Instruction Manual for DAC3 HGC and DAC3 L with 2.X Firmware Page 51
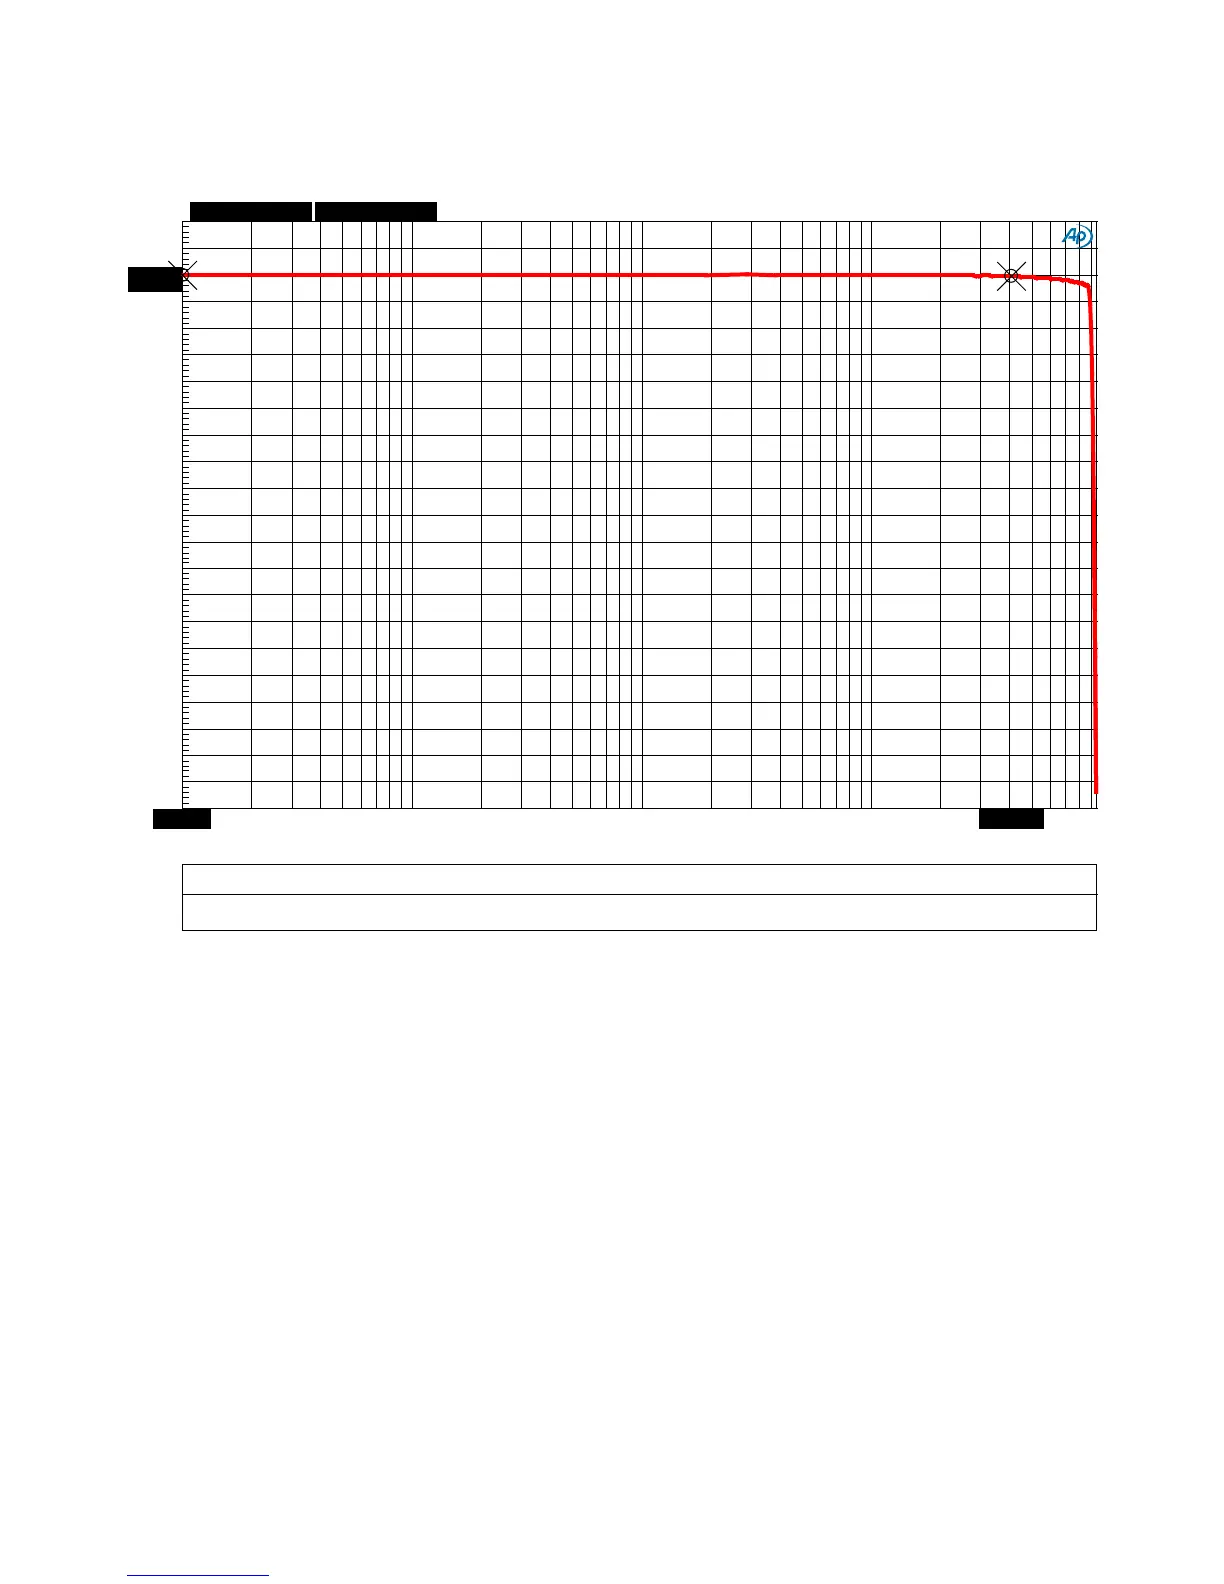
Graph 5 - Frequency Response
This plot demonstrates the ruler-flat frequency response of the DAC3. Note that the frequency
response measures - 0.015 dB at 10 Hz and -0.031 dB at 40 kHz. The extreme low-frequency
extension of the DAC3 virtually eliminates the phase shifts that often occur at low frequencies
(near 20 Hz). Bass is rendered in the proper timing relative to high-frequency content.
DAC3 - FREQUENCY RESPONSE
DAC3 - Frequency Response.at27
ColorSweep
Trace Line Style Thick
Data Axis Comment Cursor1 Cursor2
1
1 Red Solid 4 Anlr.Level A Left *-0.015 dBr *-0.031 dBr
-10
+1
-9.5
-9
-8.5
-8
-7.5
-7
-6.5
-6
-5.5
-5
-4.5
-4
-3.5
-3
-2.5
-2
-1.5
-1
-0.5
-0
+0.5
10 90k 20
50
100 200 500 1k
2k 5k 10k 20k
50k
10.0021
40.8557k