Instruction Manual for DAC3 HGC and DAC3 L with 2.X Firmware Page 50
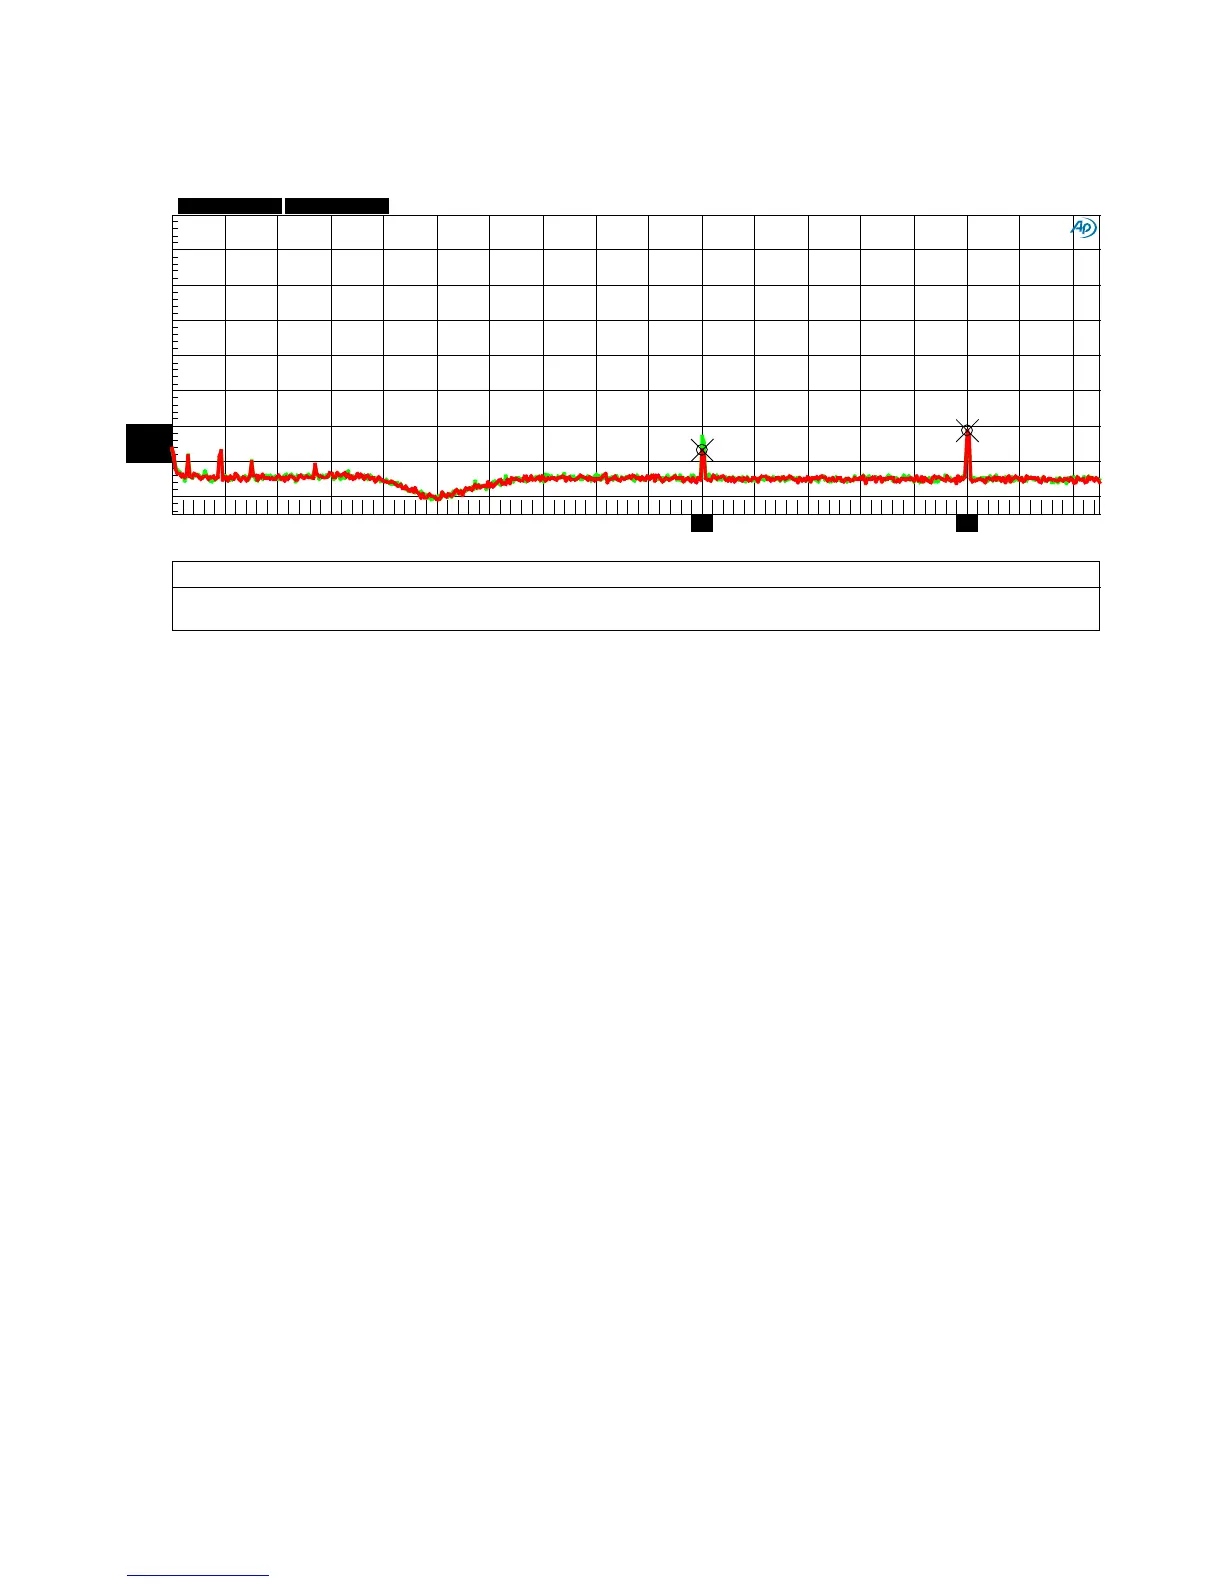
Graph 4 - FFT 1 kHz
The 1 kHz FFT analysis demonstrates the very low harmonic distortion of the DAC3. The second
harmonic distortion (2 kHz) measured better than -126 dB, while the 3rd harmonic distortion
measured better than -122 dB relative to the amplitude of the 1 kHz test tone.
This 32k point FFT analysis uses a Blackman-Harris window with 16x power averaging. The 1 kHz
fundamental has been removed by a notch filter in order to increase the resolution of the A/D
converter in the AP2722 test set.
Note that under this full-output condition, the AC line-related hum frequencies (60 Hz, 180 Hz, and
240 Hz) measure better than - 133 dB.
DAC3 - FFT 1 kHz, 0 dBr = 0 dBFS = 24 dBu
ColorSweep
Trace
Line Style Thick Data
Axis Comment Source 2 Cursor1 Cursor2
1
2 Green Solid 4 Fft.Ch.1 Ampl Left Left Channel : 1.00000 =Swr.Ch. A Input -125.680 dBr A -123.514 dBr A
2 2
Red
Solid 4 Fft.Ch.1 Ampl
Left Right Channel : 2.00000 =Swr.Ch. A Input *-133.647 dBr *-122.546 dBr
-160
+0
-140
-120
-100
-80
-60
-40
-20
0 3.4k 200 400
600
800 1k 1.2k 1.4k 1.6k 1.8k 2k 2.2k 2.4k 2.6k 2.8k
3k 3.2k
2k
3k