Instruction Manual for DAC3 HGC and DAC3 L with 2.X Firmware Page 49
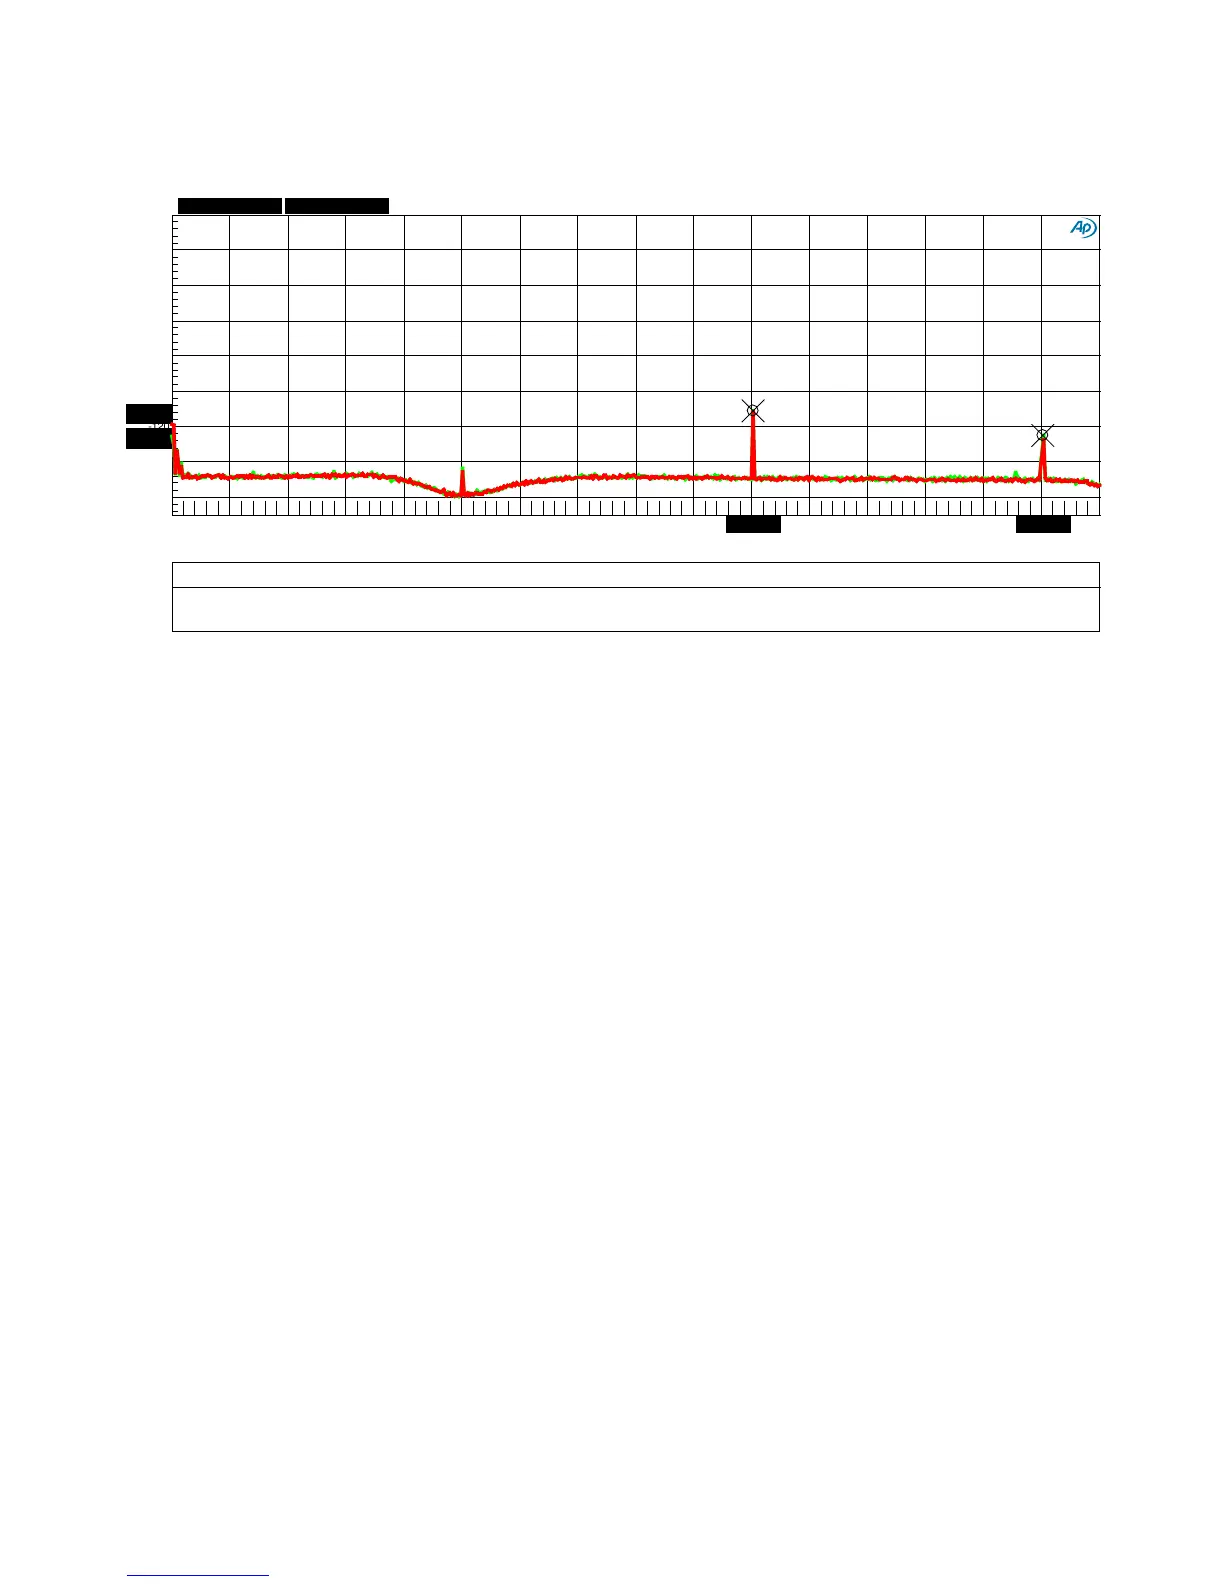
Graph 3 - FFT 10 kHz
The 10 kHz FFT analysis is an excellent test for detecting sample clock jitter. Jitter will create
sidebands (unwanted tones) above and below the 10 kHz test tone. For example, a jitter frequency
of 1 kHz would create two sideband tones; a lower sideband at 9 kHz, and an upper sideband at 11
kHz. Similarly, a jitter frequency of 2 kHz would produce sideband tones at 8 kHz and 12 kHz. The
above plot shows no evidence of jitter-induced sidebands to a measurement limit of about -149 dB
relative to the amplitude of the 10 kHz test tone.
Note the very low harmonic distortion; the 2nd harmonic (20 kHz) measured -111 dB, and the 3rd
harmonic (30 kHz) measured -125 to -127 dB.
This 32k point FFT analysis uses a Blackman-Harris window with 16x power averaging. The 10 kHz
fundamental has been removed by a notch filter in order to increase the resolution of the A/D
converter in the AP2722 test set.
DAC3 - FFT 10 kHz, 0 dBr = 0 dBFS = 24 dBu
ColorSweep Trace
Line Style Thick
Data
Axis Comment
Source 2 Cursor1 Cursor2
1 2 Green Solid 4
Fft.Ch.1 Ampl Left : 1.00000 =Swr.Ch. A Input *-111.013 dBr *-124.989 dBr
2 2 Red Solid
4 Fft.Ch.1 Ampl
Left : 2.00000 =Swr.Ch. A Input
-111.241 dBr A
-127.362 dBr A
-160
+0
-140
-120
-100
-80
-60
-40
-20
0 32k 2k 4k 6k
8k
10k 12k 14k 16k 18k 20k 22k 24k
26k
28k
30k
20.0391k 30.0587k