Instruction Manual for DAC3 HGC and DAC3 L with 2.X Firmware Page 53
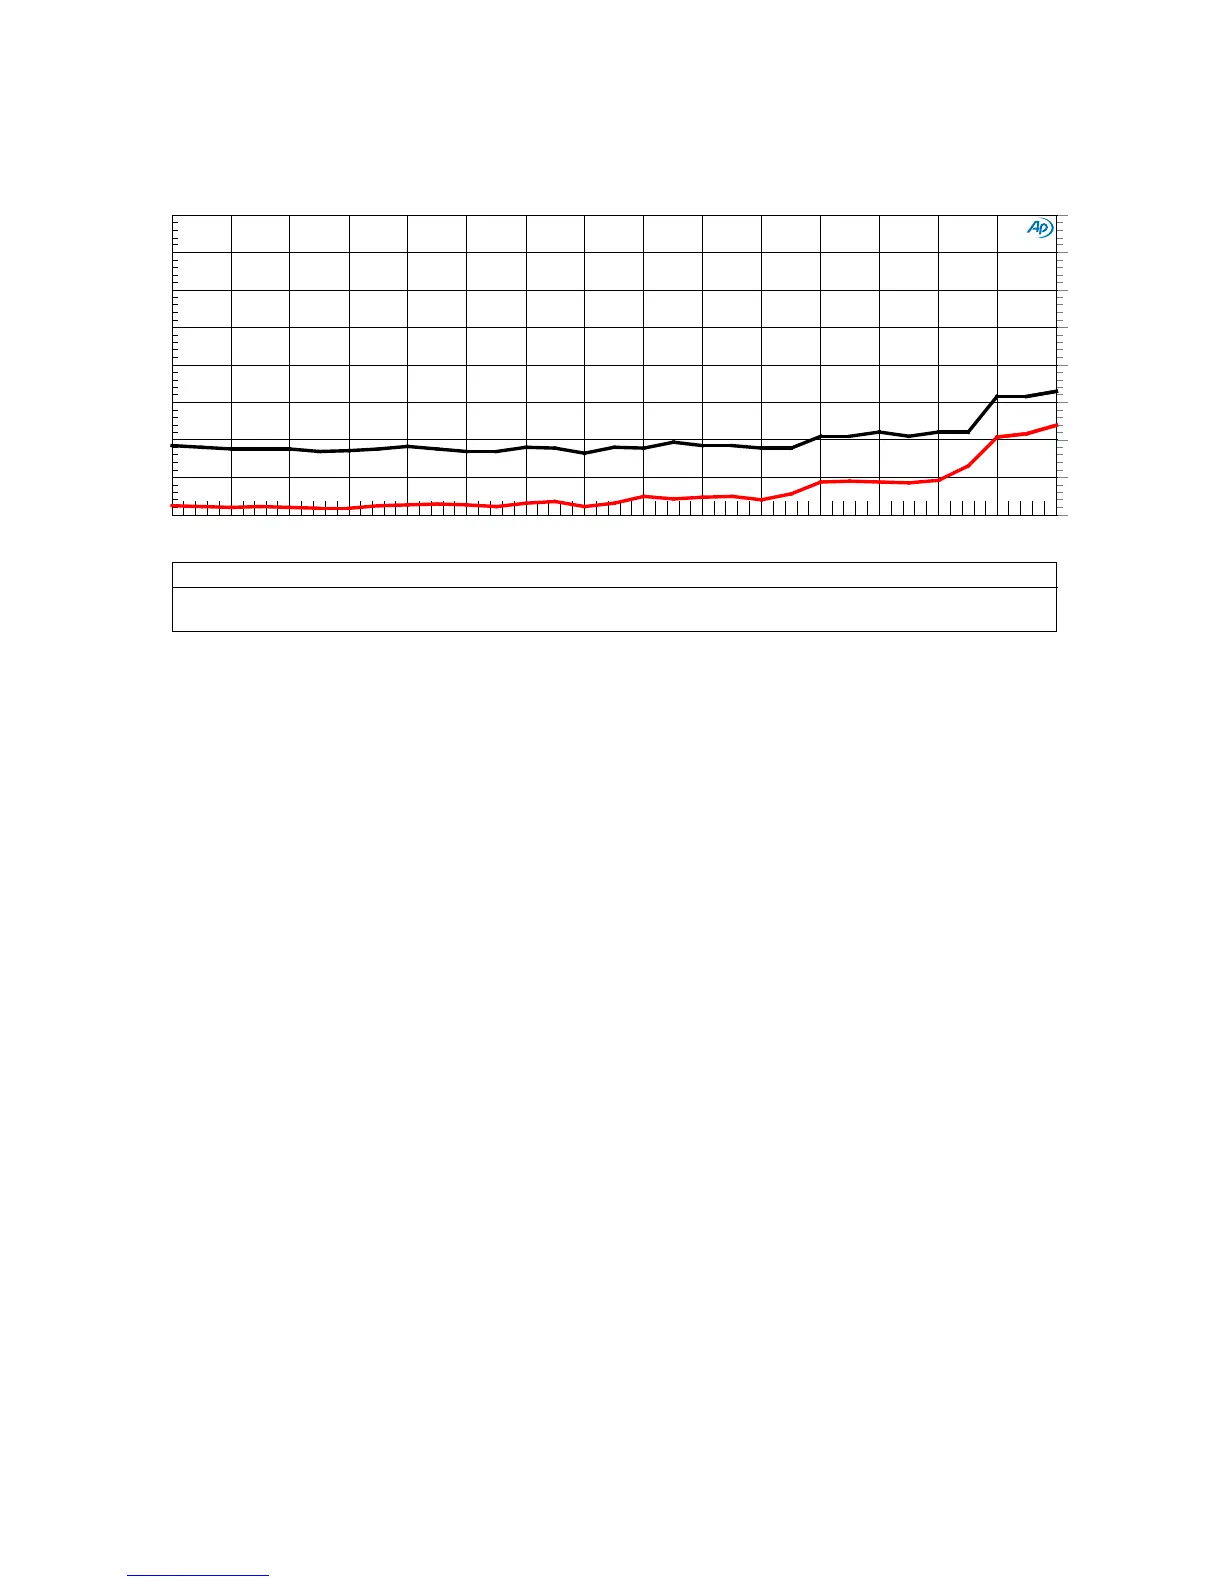
Graph 7 - THD and THD+N vs. Amplitude (Balanced Outputs)
These plots demonstrate the very low harmonic distortion produced by the DAC3 with digital input
signal levels ranging from -30 dBFS to 0 dBFS. These plots show that THD should never reach the
threshold of hearing in most listening environments. This is proof that the DAC3 is virtually
uncolored by any traces of harmonic distortion.
The black curve is a plot of THD+N, band limited to 22 kHz, and was acquired using the analog
analyzer in the AP2722 test set. The red curve is a plot of THD (harmonic distortion only) and was
acquired using the analog notch filter, A/D converter, and digital harmonic distortion analyzer in
the AP2722 test set. This THD curve includes all harmonics falling below 32 kHz. The steps near -3
dBFS and -9 dBFS are due to the auto ranging of the AP2722 test set and are an indication that the
THD performance of the DAC3 is very close to the measurement limits of the AP2722.
DAC3 - THD and THD+N vs. Amplitude, 1 kHz, 0 dBFS = 24 dBu
DAC3 - THD and THD+N vs Amplitude.at27
ColorSweep Trace Line Style
Thick Data
Axis Comment
1
1 Red Solid
4 Distortion.Ch.1 Harm Sum1 Left THD
1 2 Black Solid 4
Anlr.THD+N Ampl Right
THD+N
-130
-90
-125
-120
-115
-110
-105
-100
-95
-130
-90
-125
-120
-115
-110
-105
-100
-95
-30 -0 -28 -26 -24
-22
-20 -18 -16 -14 -12 -10 -8 -6
-4
-2