Instruction Manual for DAC3 HGC and DAC3 L with 2.X Firmware Page 54
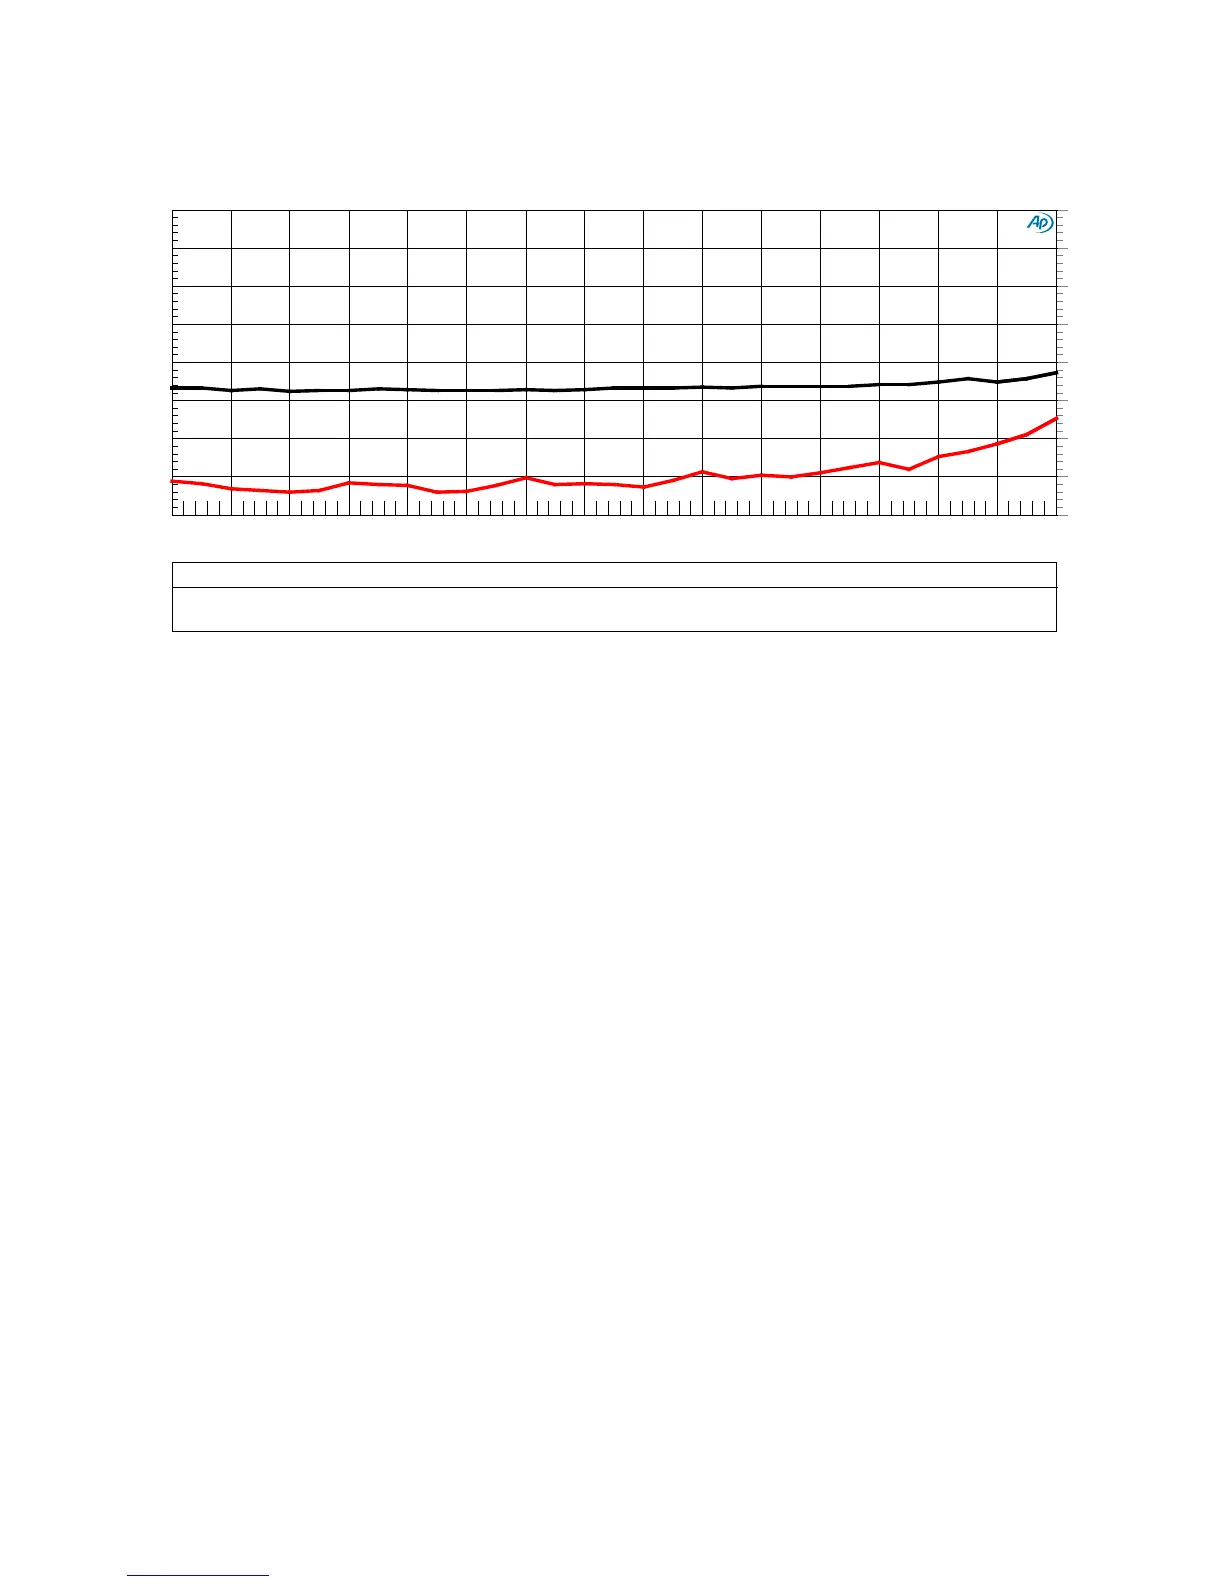
Graph 8 - THD and THD+N vs. Amplitude (Unbalanced Outputs)
This plot shows the THD and THD+N performance of the unbalanced outputs.
Note that the THD performance of the unbalanced outputs approaches that of the balanced
outputs. The THD+N levels are slightly higher on the unbalanced outputs. This is due to the
relatively low (2 Vrms) signal levels used on unbalanced interfaces. This noise difference highlights
one advantage of professional-level balanced interconnects.
DAC3 - THD and THD+N vs. Amplitude, 1 kHz, 0 dBFS = 2Vrms
DAC3 - THD and THD+N vs Amplitude Unbalanced.at27
ColorSweep Trace Line Style
Thick Data
Axis Comment
1
1 Red Solid
4 Distortion.Ch.1 Harm Sum1 Left THD Only
1 2 Black Solid 4
Anlr.THD+N Ampl Right
THD+N
-130
-90
-125
-120
-115
-110
-105
-100
-95
-130
-90
-125
-120
-115
-110
-105
-100
-95
-30 -0 -28 -26 -24
-22
-20 -18 -16 -14 -12 -10 -8 -6
-4
-2