Instruction Manual for DAC3 HGC and DAC3 L with 2.X Firmware Page 59
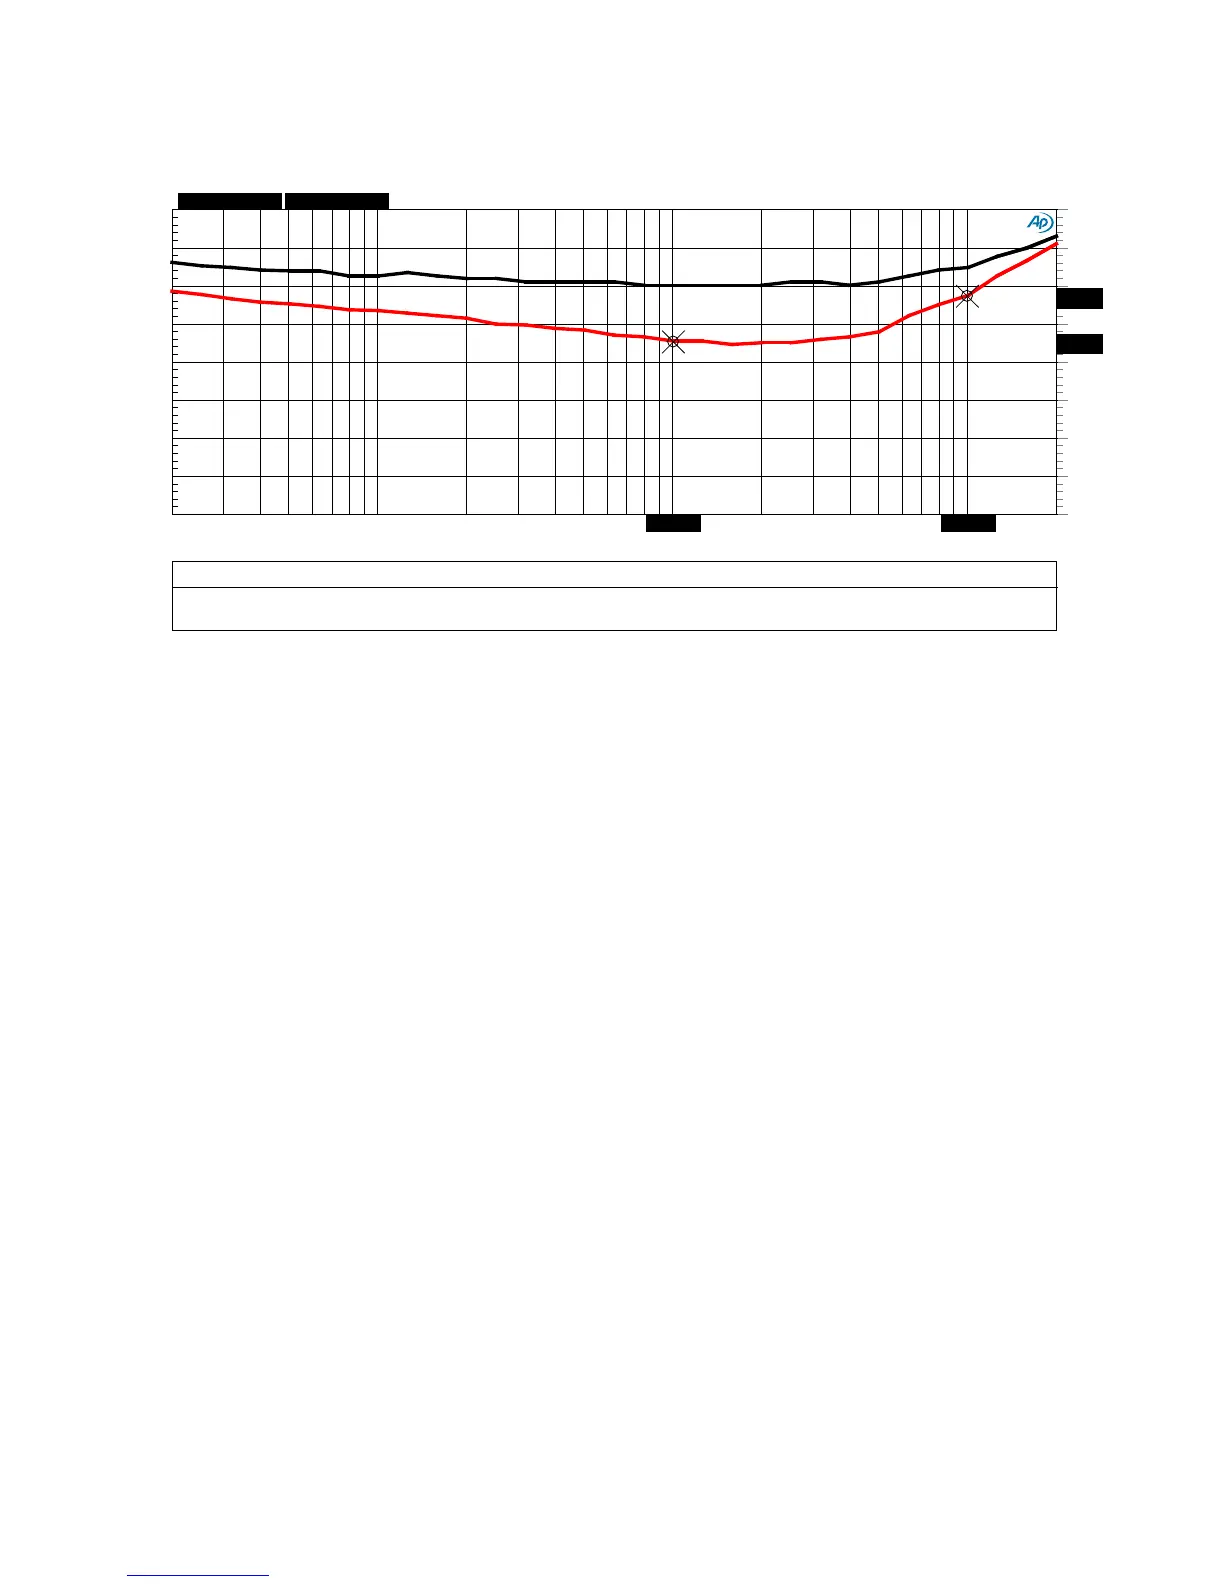
Graph 13 - THD and THD+N vs. Frequency
These plots demonstrate that the harmonic distortion of the DAC3 is lower than the THD+N
numbers would suggest. This black curve is a plot of THD+N. The red curve is a plot of THD only.
Below about 10 kHz, the THD is so low that the THD+N measurement is dominated by noise.
DAC3 - THD and THD+N vs. Frequency, 1 kHz, 0 dBFS, 24 dBu
Digital In to Balanced Analog Out
DAC3 - THD and THD+N vs Frequency Digital to Analog.at27
ColorSweep
Trace Line Style Thick
Data Axis Comment Cursor1 Cursor2
1
1 Black
Solid 4 Anlr.THD+N Ampl Left THD+N, 80 kHz LPF-109.838 dBr A -107.584 dBr A
1
2 Red Solid 4 Distortion.Ch.1 Harm Sum1 Right THD, 48 kHz LPF
*-117.274 dBr *-111.274 dBr
-140
-100
-135
-130
-125
-120
-115
-110
-105
-140
-100
-135
-130
-125
-120
-115
-110
-105
20
20k
50 100
200 500 1k 2k 5k 10k
1.00238k
10.0237k