Gene Expression Analysis
106
Gene Expression Spreadsheet
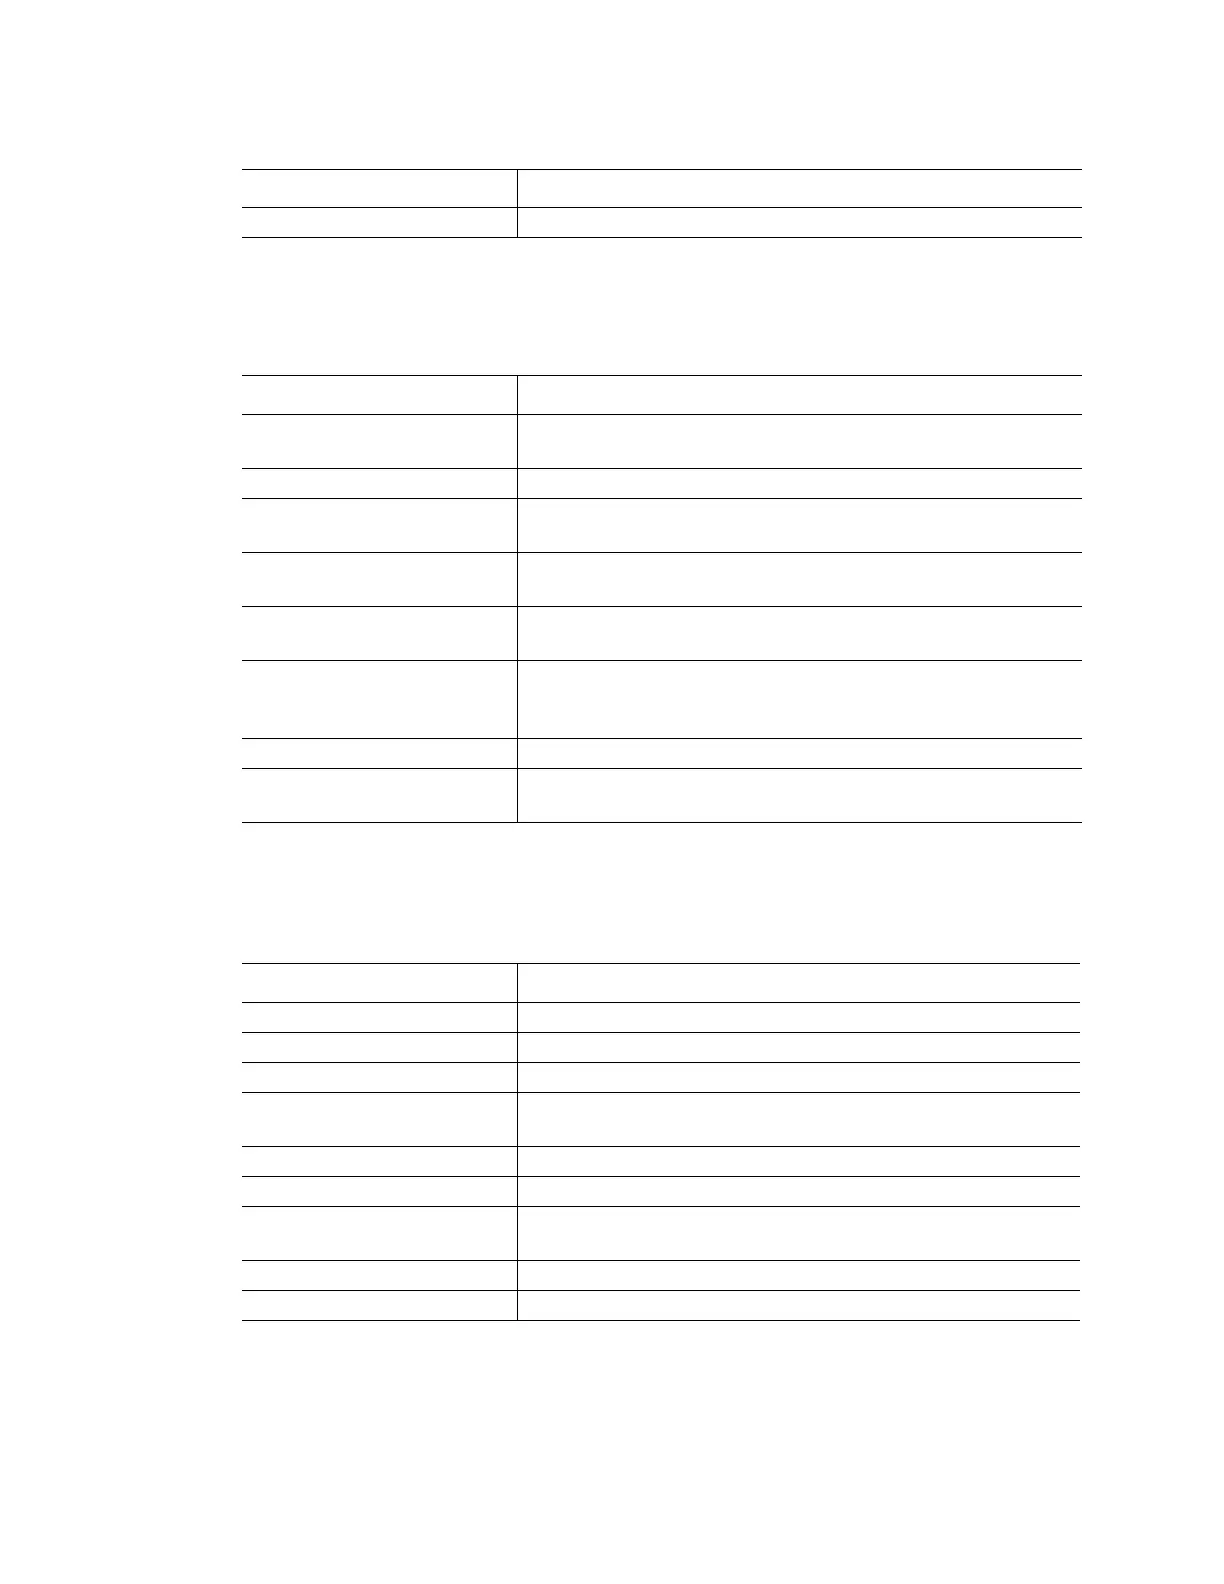
Table 38 describes the information shown in the Gene Expression spreadsheet.
Show Details Option
When you click the Show Details check box, Table 39 also shows this information.
X-axis labels Choose to display x-axis labels horizontal or angled
Table 38. Description of information in the spreadsheet on the Gene Expression tab
Information Description
Target Target Name (amplified gene) selected in the Experiment
Settings window
Sample Sample Name selected in the Experiment Settings window
Ctrl Control sample, when the Sample Name is selected as a
control in the Experiment Settings window
Expression Normalized Gene Expression (ΔΔC(t)) or Relative quantity
(ΔC(t)) depending on the selected mode
Expression SEM (or SD) Standard Error of the Mean or Standard Deviation, depending
on the selected option
Corrected Expression SEM
(or SD)
Corrected value calculation for Standard Error of the Mean
(SEM) or Standard Deviation (SD) of the relative expression,
depending on the selected option
Mean (C(t)) Mean of the threshold cycle
C(t) SEM (or SD) Standard Error of the Mean or Standard Deviation of the
threshold cycle, depending on the selected option
Table 39. Information in Gene Expression spreadsheet with Show Details selected
Information Description
Data Set Fluorescence data from one fluorophore in the data file
Relative Quantity Calculated relative quantity of samples
Relative Quantity SD Standard deviation of the relative quantity calculation
Corrected Relative Quantity
SD
Calculated standard deviation of the corrected relative
quantity
Unscaled Expression Calculated unscaled expression
Unscaled Expression SD Calculated standard deviation unscaled expression
Corrected Unscaled
Expression SD
Calculated standard deviation of the unscaled expression
Expression Relative expression level
Wells Well number in the plate
Table 37. Right-click menu items (continued)
Item Function