CFX96 and CFX384 Systems Manual
111
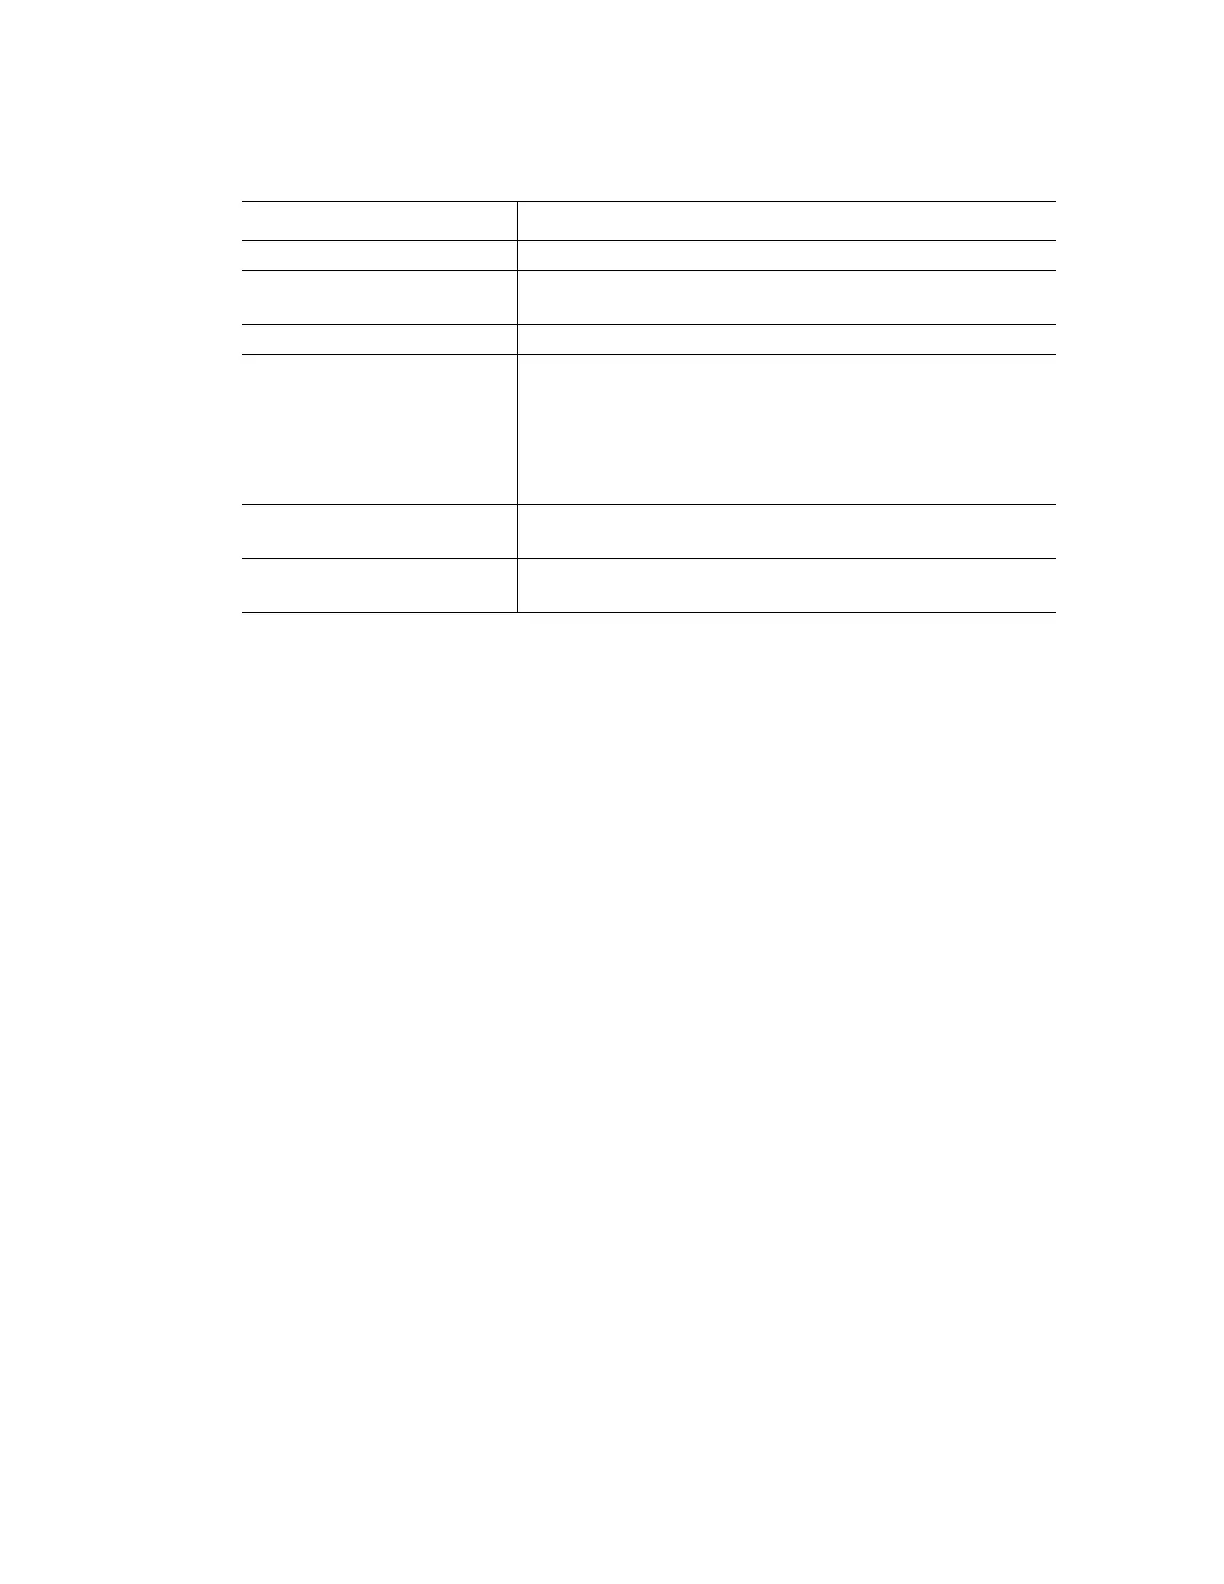
The Study Setup tab lists the data files in the Gene Study, as described in Table 40.
Study Analysis Tab
The Study Analysis tab shows the data from all experiments that are added to the Gene Study.
Open this tab to analyze the data, and select these options for the Gene Expression chart:
• Mode. Select Normalized Expression (ΔΔC(t)) or Relative Quantity (ΔC(t))
• Graph Data. Select Relative to normal or Relative to control in the graph
• X-axis options. Select the labels on the x-axis of the graph, including Sample or Target
• Y-axis options. Change the labels on the y-axis of the graph, including Linear, Log 2, or
Log 10
• Scaling Options. Choose Highest value, Lowest value, or leave the data Unscaled.
This option is only available when your samples do not contain controls
• Graph Error. Select the multiplier for standard deviation bars in the graph, including ±1,
2, or 3
• Experiment Settings button. Choose the show options for targets and samples in the
Experiment Settings window
• Show Details check box. Click Show Details to add more columns of data to the chart
Table 40. Study Setup tab in Gene Study window
Column Title Description
File Name Name of the experiment data file (.pcrd extension)
File Folder Directory that stores the data file for each experiment in the
Gene Study
Date Created Date the run data were collected
Well Group Name Name of the well group that was selected when the file was
added to the Gene Study
TIP: In order to analyze one well group in the Gene Study,
that well group must be selected in the Data Analysis
window before importing the data file into the Gene Study
Step Protocol step that included the plate read to collect real-
time PCR data
Grid View Open a plate map of the plate with the data in each of the
experiments included in the Gene Study



 To Next Page