| 71S3 Cell Sorter Instruction Manual | 71
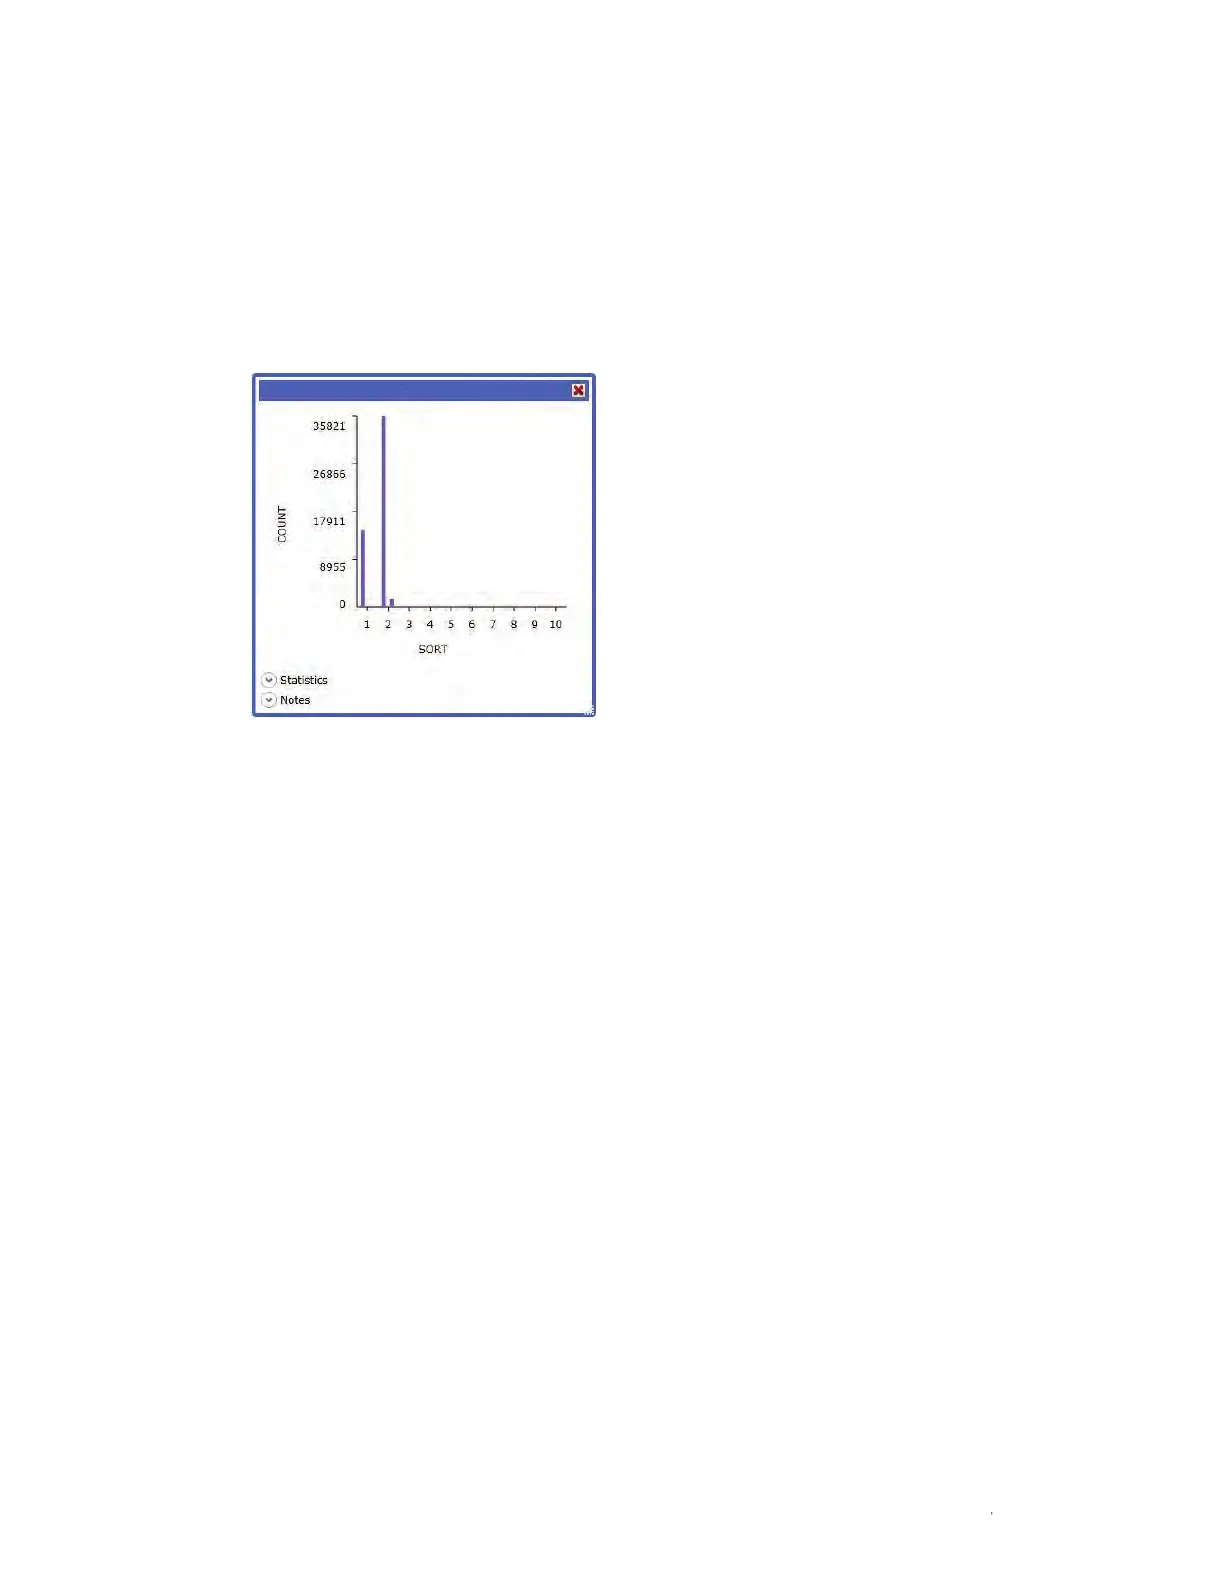
6.4 Sort Plots
During a sorting experiment a sort plot can be created in the current protocol. This plot
displays graphically the counts of events (sorts and aborts) per tube/well/slide spot in the sort
run. The data on this sort plot (Figure 77) correspond to the Sort Statistics window (Figure 76).
The numbers 1–10 are the sort position designations as assigned in the Sort Logic window
(Figure 74). Regions can be applied to the sort plot. These regions can be applied to other
histograms or density plots.
Fig. 77. Sort Plot window.