Theory of Operation
15
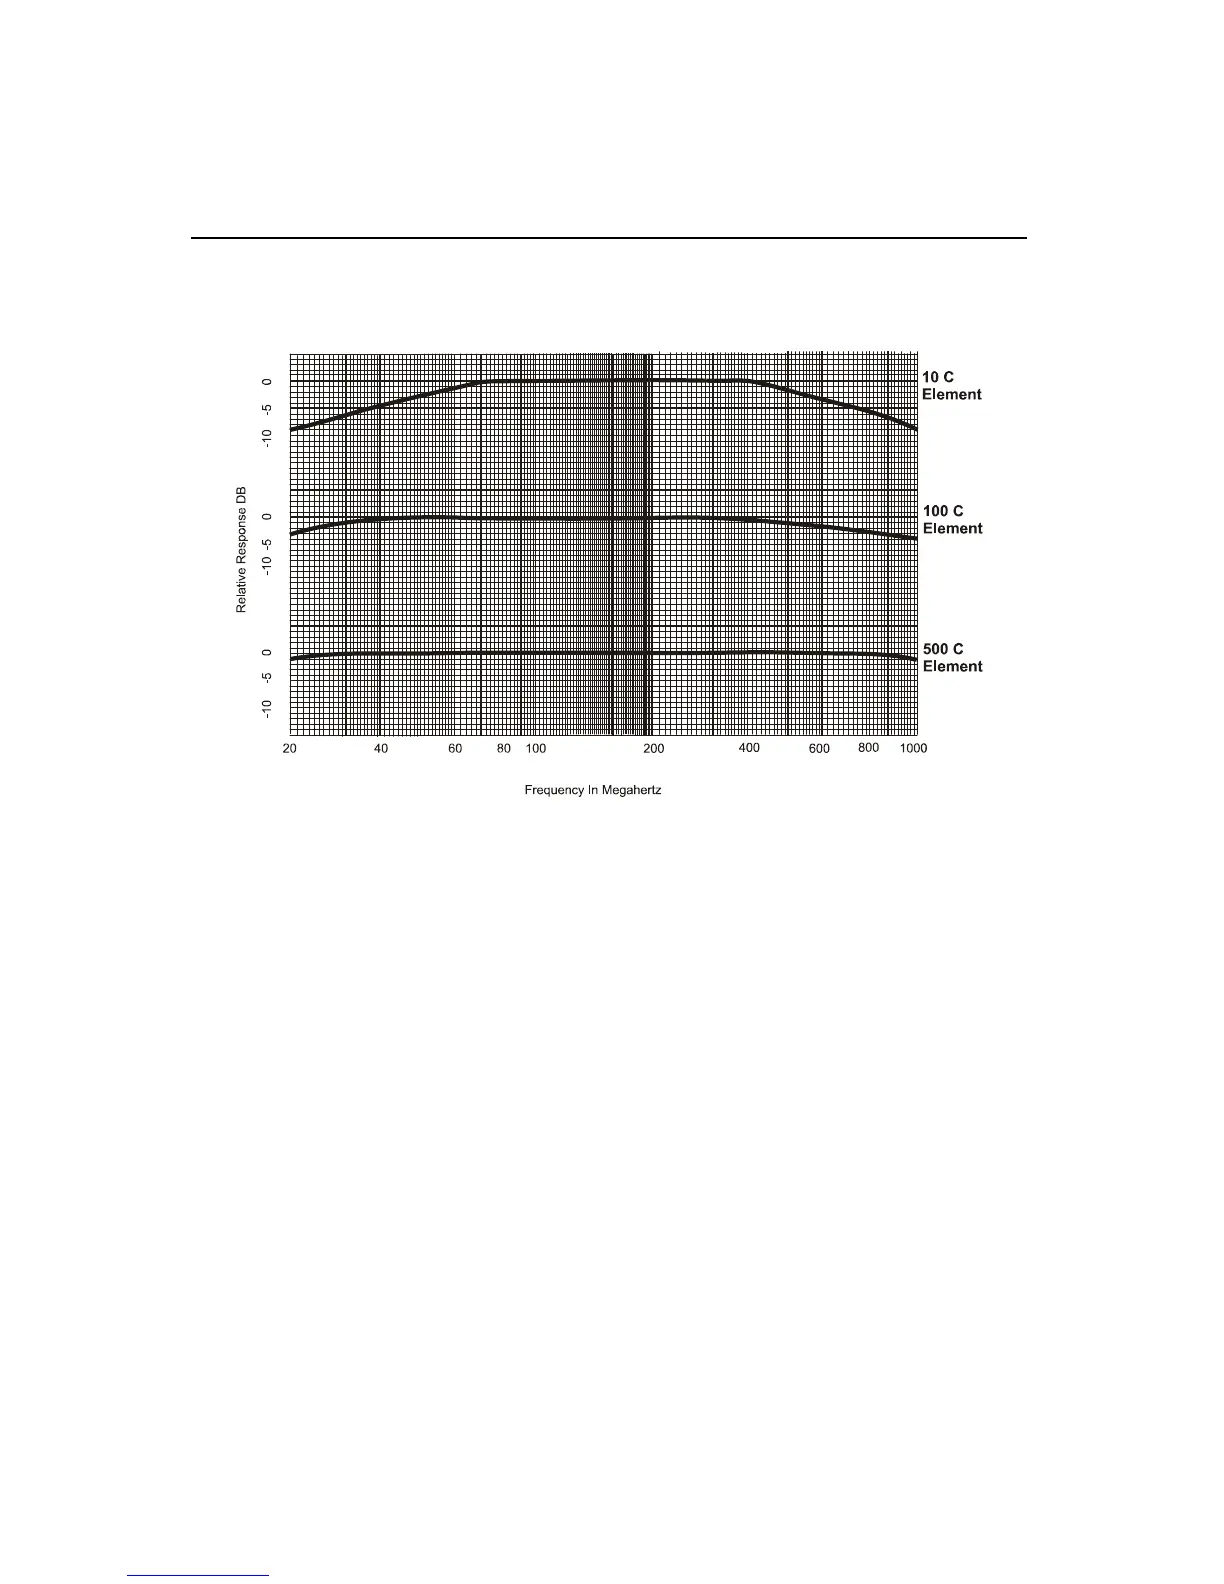
These curves are typical for all element types (H, A, B, C, D, ...) at
their respective frequencies. Since a C type element has a frequency
range of 100 - 250 MHz, response curves for other element types can
be approximated by replacing the 100 and 250 MHz points on the
chart with the extremes of the element’s frequency range, and recalc-
ulating the other frequency points accordingly. For example, for a B
element (range 50 - 125 MHz) simply divide all frequencies by two. For
an E element (range 400 - 1000 MHz) multiply all frequencies by four.
Harmonics or subharmonics that lie outside of the frequency range of
the element may exist in the circuit under test. A rough
approximation of the element’s response to harmonics can be made
with these curves. Using an element for measurements outside of its
frequency range is not recommended. The response curves presented
are only typical, and not guaranteed.
Figure 6
Representative Frequency Response