Patient Monitor User’s Manual
1-9
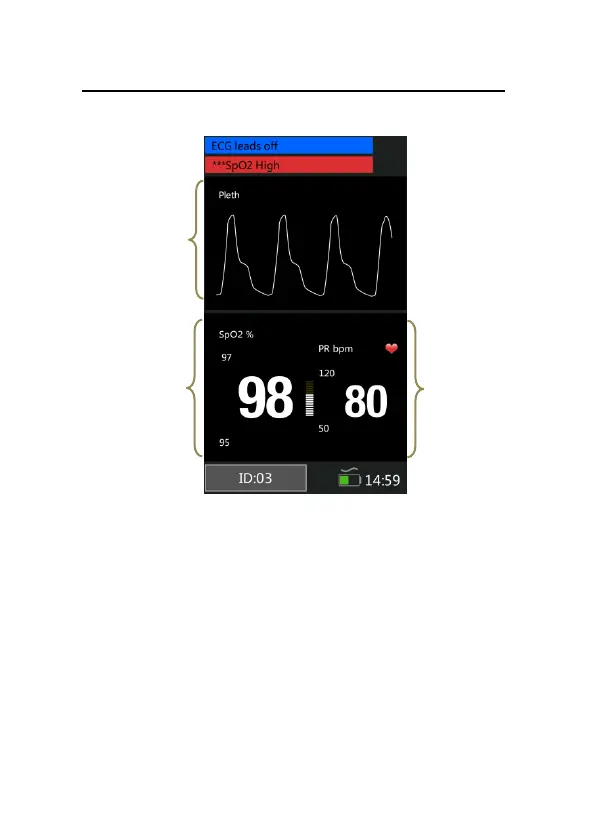
1.3.2 SpO2 Display mode
Fig 1-5 SpO2 Display Mode
1. SpO2 waveform area: The waveform shown in the area is
current SpO
2
volume curve.
2. SpO
2
parameter area: The values shown in the area are
current SpO
2
value and its higher and lower alarm limits.
3. PR parameter area: The values shown in the area are
current PR value and its upper and lower alarm limits.
1
2
3