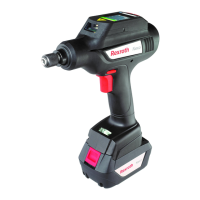
3 608 870 A47 Tightening Technology | Bosch Rexroth AG 183/263
Nexo cordless Wi-Fi nutrunner | 3 608 870 A47/2017-05
9.4.3 Actual graph
Analysis Actual graph
Use this menu item to display the results of the current tightening job, if any, in a graphical diagram. The
measurement values are displayed against the angle (Angle button) or against the time (Time button).
After displaying the actual graph, the operating system automatically requests the next graph.
9.4.4 Stored graphs
Analysis Stored graphs
Use this menu item to display the results of a stored tightening job, if any, in a graphical diagram. The
measurement values are displayed against the angle (Angle button) or against the time (Time button).
After displaying the actual graph, the operating system automatically requests the next graph.
Table 9–6: Actual graph tab
Element Description
Min Lower zoom area limit
Max Upper zoom area limit
100% Shows the complete graph
Points Number of graph points contained in the zoom area and total number of
graph points (display only)
If Internet Explorer version 8 is used as browser, a problem may arise in connection with curves that are
represented with a great number of points. In this case, the "Stop running this scrip" error message will
be displayed.
Table 9–7: Curve memory tab
Element Description
<< Jumps to the first stored graph
< Jumps to the previous stored graph
<number> Enter a tightening number. The result of this tightening process will then be
displayed in the stored graphs.
> Jumps to the next stored graph
>> Jumps to the last stored graph
All Displays all of the stored graphs
OK Displays nothing but stored OK graphs
NOK Displays nothing but stored NOK graphs
Depending on the selection of All, OK or NOK, the number of saved tighten-
ings will be displayed.
Min Lower zoom area limit
Max Upper zoom area limit
100% Shows the complete graph
 Loading...