Model 428 User’s Manual REMOTE USER INTERFACE
Bristol Instruments, Inc. 29
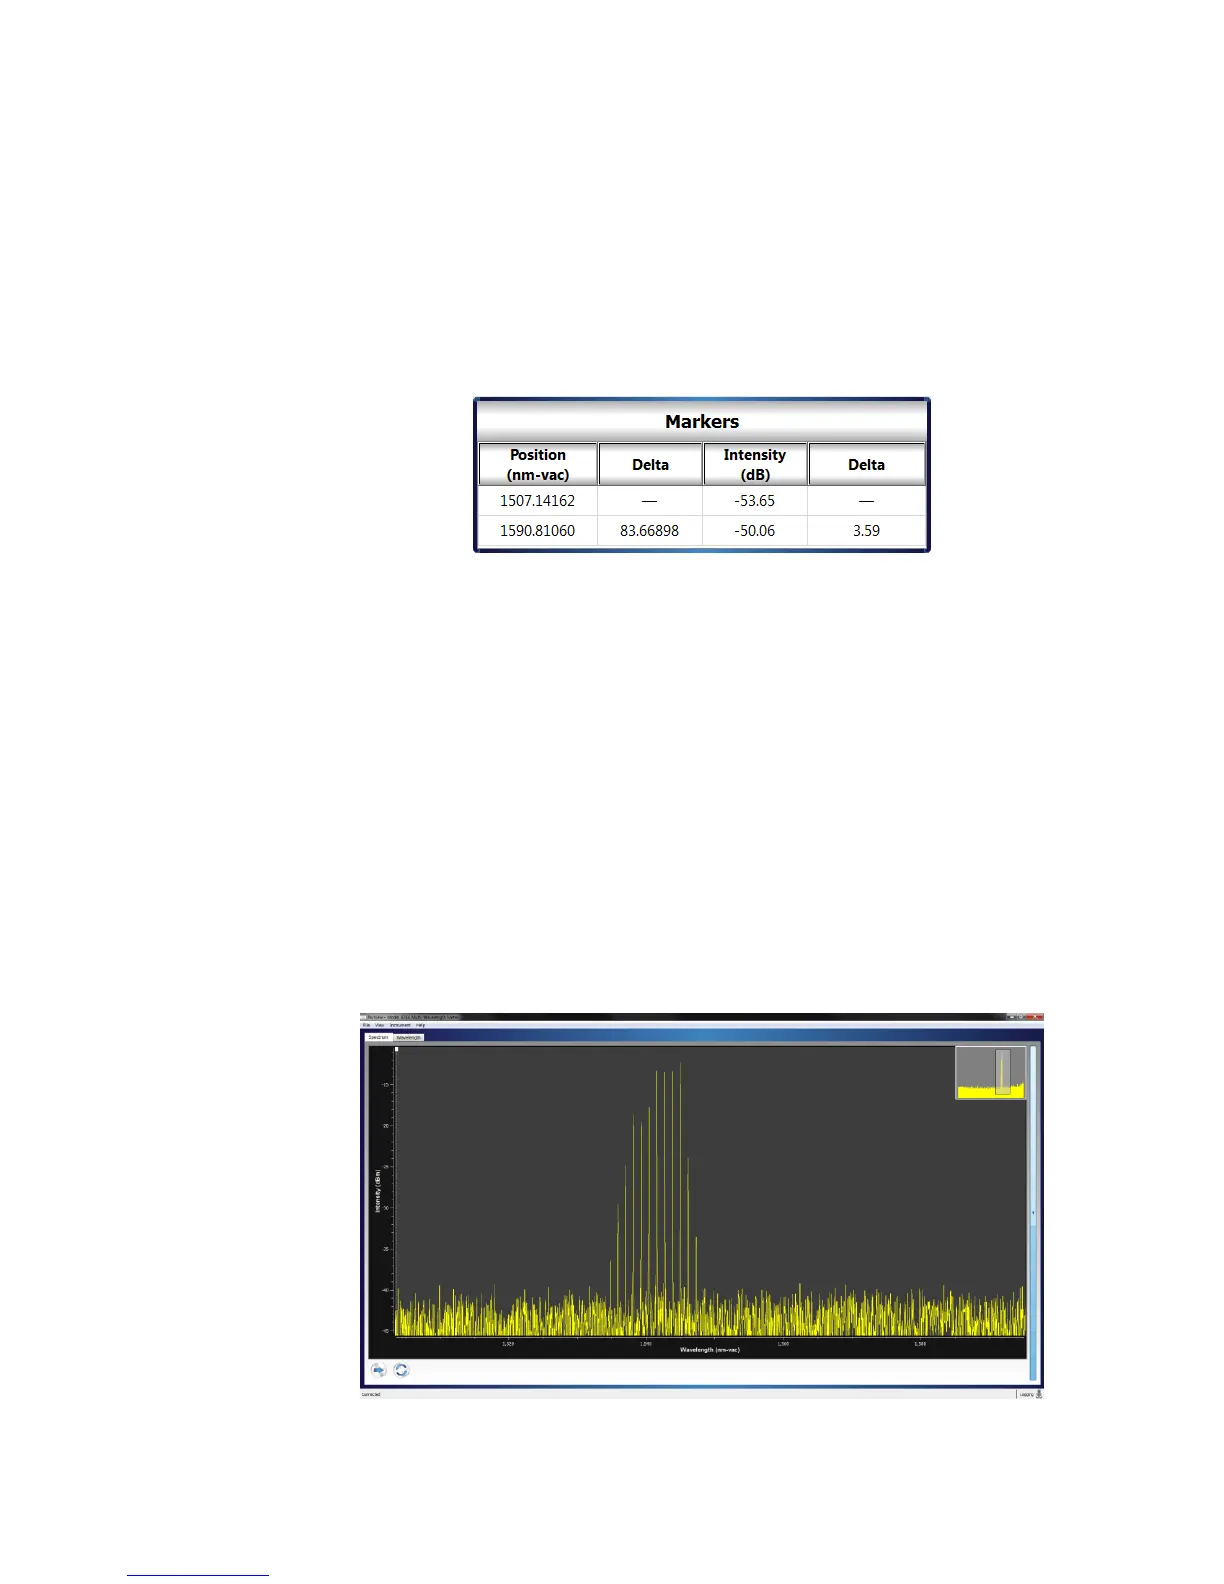
Markers Table
A pair of Markers are available that can be positioned at any point in the
Spectrum Display for quantitative analysis. A Marker identifies the intensity of the
measured spectrum at a specific spectral position. They are displayed as small
rectangles at the top of the Spectrum Display with vertical tracing lines extending
to the spectral axis.
The Markers Table displays the spectral position (Position), difference between
the two Markers’ spectral positions (Delta), intensity (Intensity), and difference
between the two Markers’ intensity values (Delta).
Figure 4.6: Markers Table
The Markers are always visible in the fully zoomed out Spectrum Display. A
Marker can be repositioned by left-clicking anywhere on the Marker and dragging
it to the desired location. If the Spectrum Display is zoomed in, the Markers may
not be visible. In this case, the Markers can be positioned by right-clicking at the
desired location, and selecting Place Marker 1 or Place Marker 2 in the Zoom
and Marker Menu (Figure 4.4).
Display Expand/Collapse
The Spectrum Display can be expanded or collapsed by using the
Expand/Collapse button to the right of the Spectrum Display.
Expanding the Spectrum Display allows for a larger viewing area of the
measured spectrum. When expanded, the larger viewing area hides the Optical
Channels and Markers Tables. (Figure 4.7).
Figure 4.7: Spectrum Display Expanded
 Loading...