Model 871A User’s Manual USING THE LASER WAVELENGTH METER
Bristol Instruments, Inc. 14
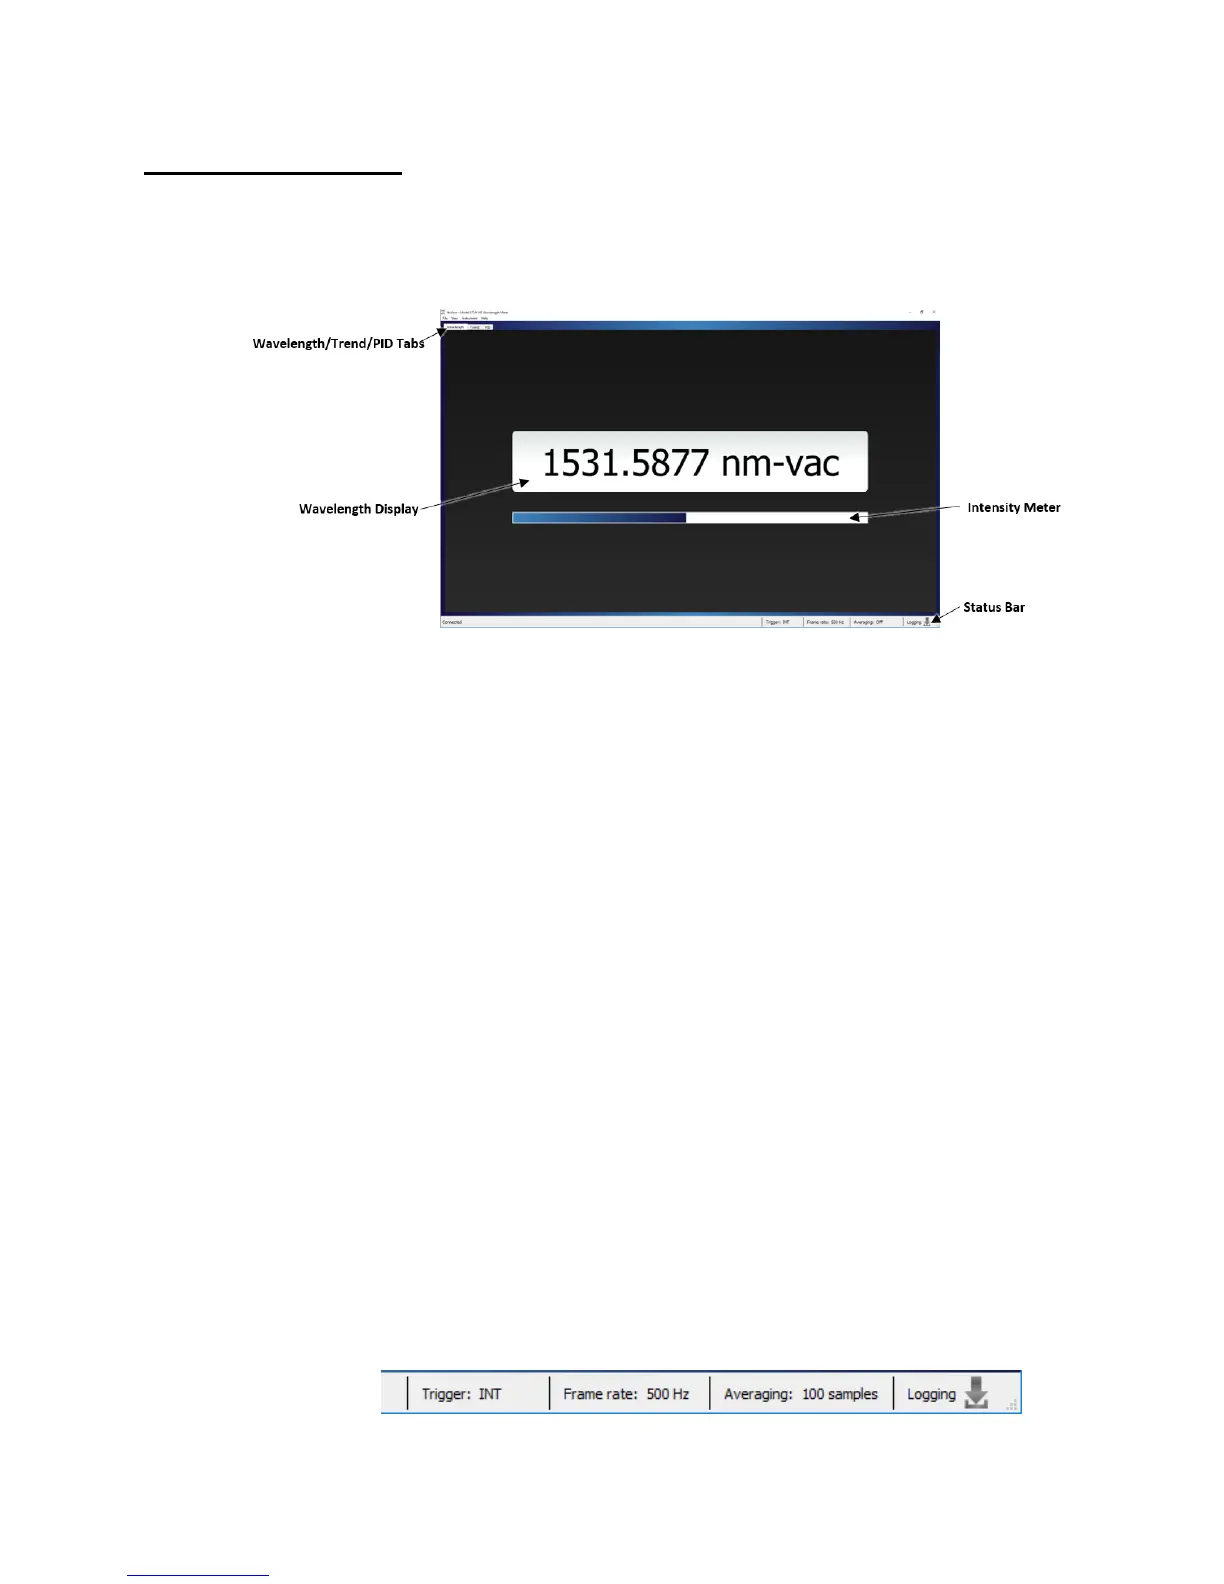
Wavelength Screen
The Wavelength Screen of the NuView software displays the absolute wavelength,
wavenumber, or frequency of the laser under test. Once the application is connected to
the instrument, the Wavelength display will update continuously until the connection is
terminated.
Figure 4.2: Wavelength Screen
Wavelength/Trend/PID Controller Tabs
Allows the user to toggle between the Wavelength Screen, Trend Screen, and
PID Controller Screen.
Wavelength Display
Displays the absolute wavelength, wavenumber, or frequency of the laser under
test.
Intensity Meter
Graphically displays the relative intensity of the laser under test on the
instrument’s detector.
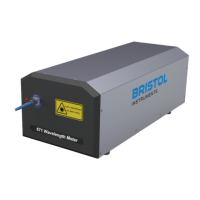
Status Bar
The Status bar is located at the bottom of the Wavelength Screen and the Trend
Screen. It provides information about the current state of the instrument as
described below (from left to right).
• Connection status – Either connected or disconnected.
• Trigger Method – Either Internal (INT), External Falling (EXT Fall), or
External Rising (EXT Rise).
• Frame Rate – The detector’s frame rate in Hz.
• Averaging – Either “Off” or the number of samples being averaged.
• Logging – The downloading icon is gray when logging status is inactive, and
green when logging status is active.
Figure 4.3: Status Bar