Model 871A User’s Manual USING THE LASER WAVELENGTH METER
Bristol Instruments, Inc. 16
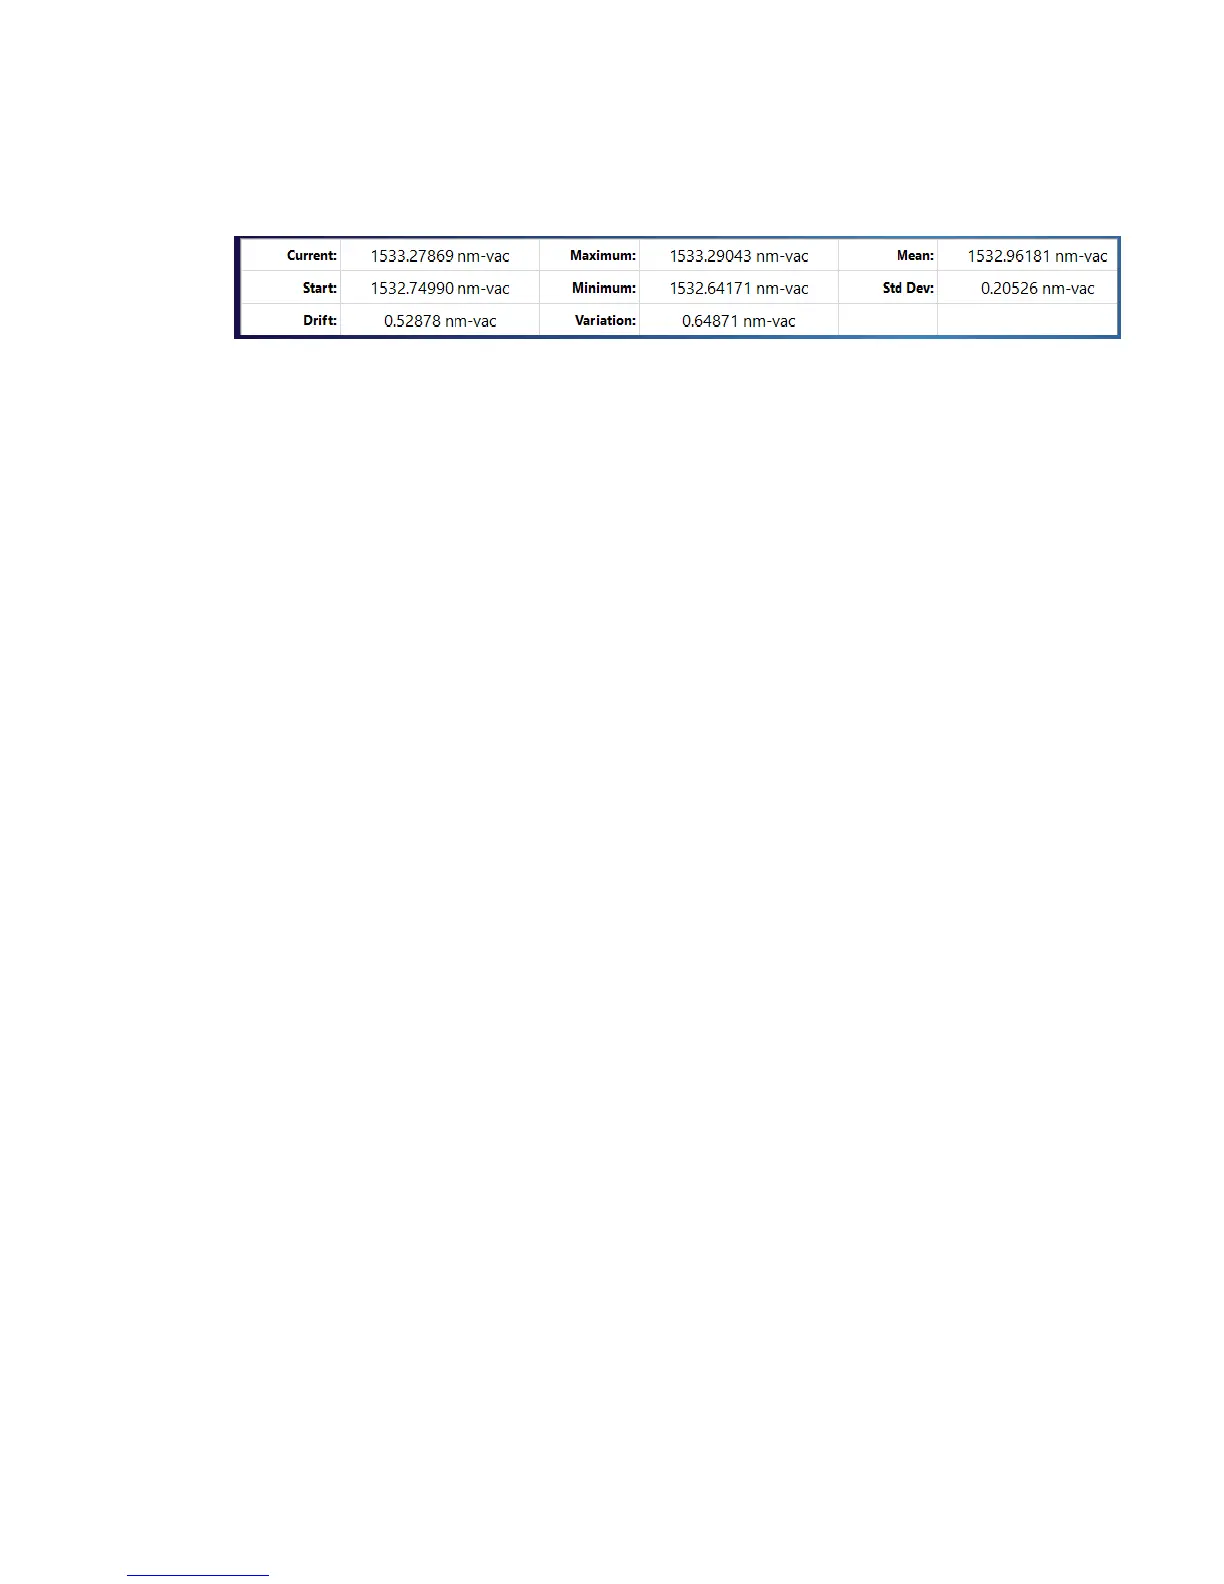
Data Table
The Data Table provides current and trending information about the laser’s
wavelength, wavenumber, or frequency.
The first column of the Data Table provides laser drift information. This column
displays the current measurement (Current), the first measurement taken after
the Trend Graph is started/reset (Start), and the difference between the Current
and Start measurements (Drift).
The second column provides the total measured variation of the laser under test.
This column displays the maximum and minimum measurements recorded on
the Trend Graph (Maximum and Minimum, respectively), and computes the
difference between them (Variation).
The third column provides some basic statistical information about the variation
of the Trend Graph. This column provides the average (Mean) and standard
deviation (Std Dev) of the Trend Graph.
Trend Graph Zoom
The Trend Graph can be magnified to focus on a portion of the trending data.
Before zooming, left-click on the Trend Graph to ensure that the Trend Graph is
active, and uncheck “Autoscale Axes” under the View Menu.
• Horizontal Zooming – Scrolling the mouse wheel upwards will zoom in
horizontally on the spectrum at the mouse cursor location. Scrolling the
mouse wheel downwards will zoom out horizontally on the spectrum at the
mouse cursor location.
• Vertical Zooming – Holding the shift key on user’s keyboard while scrolling
the mouse wheel upwards will zoom in vertically on the Trend Graph at the
mouse cursor location. Holding down the shift key while scrolling the mouse
wheel downwards will zoom out vertically on the Trend Graph at the mouse
cursor location.
Trend Graph Panning
When the Trend Graph is zoomed, left-clicking and dragging in the Trend Graph
will pan the trending data horizontally. Holding down the Shift key while left-
clicking and dragging will pan the trending data vertically.