Power Graph
43
Control Unit Serial number for Control Unit
Version number for Software
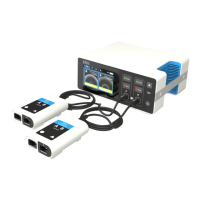
Indication of Channel A or B
Serial number for the Connector Interface Cable
Ultrasound Serial # Serial number for the Ultrasonic Core
Catheter Serial # Serial number for the Infusion Catheter
Ultrasound Zone Ultrasound treatment zone (cm)
Catheter Zone Infusion Catheter treatment zone (cm)
Ultrasonic Core with 5 transducer groups
present and active. Displayed for each catheter.
Note: number is dimmed if the transducer group
is inactive and number is not displayed if the
transducer group in not present.
Power Graph
The Control Unit monitors and presents a historical graph of the ultrasound power
delivered to the EkoSonic™ Device(s). The percentage of the maximum average power
actually delivered by each of the two channels, is plotted over time on the power graph.
The Control Unit user interface presents a historical graph of the
ultrasound power delivered. The power data should not be used for
diagnostic purposes. Diagnosis of drug/ultrasound therapy should
always be made using other clinical diagnostic tools (e.g., fluoroscopy).
An incorrect diagnosis could result in prolonged therapy or inadequate
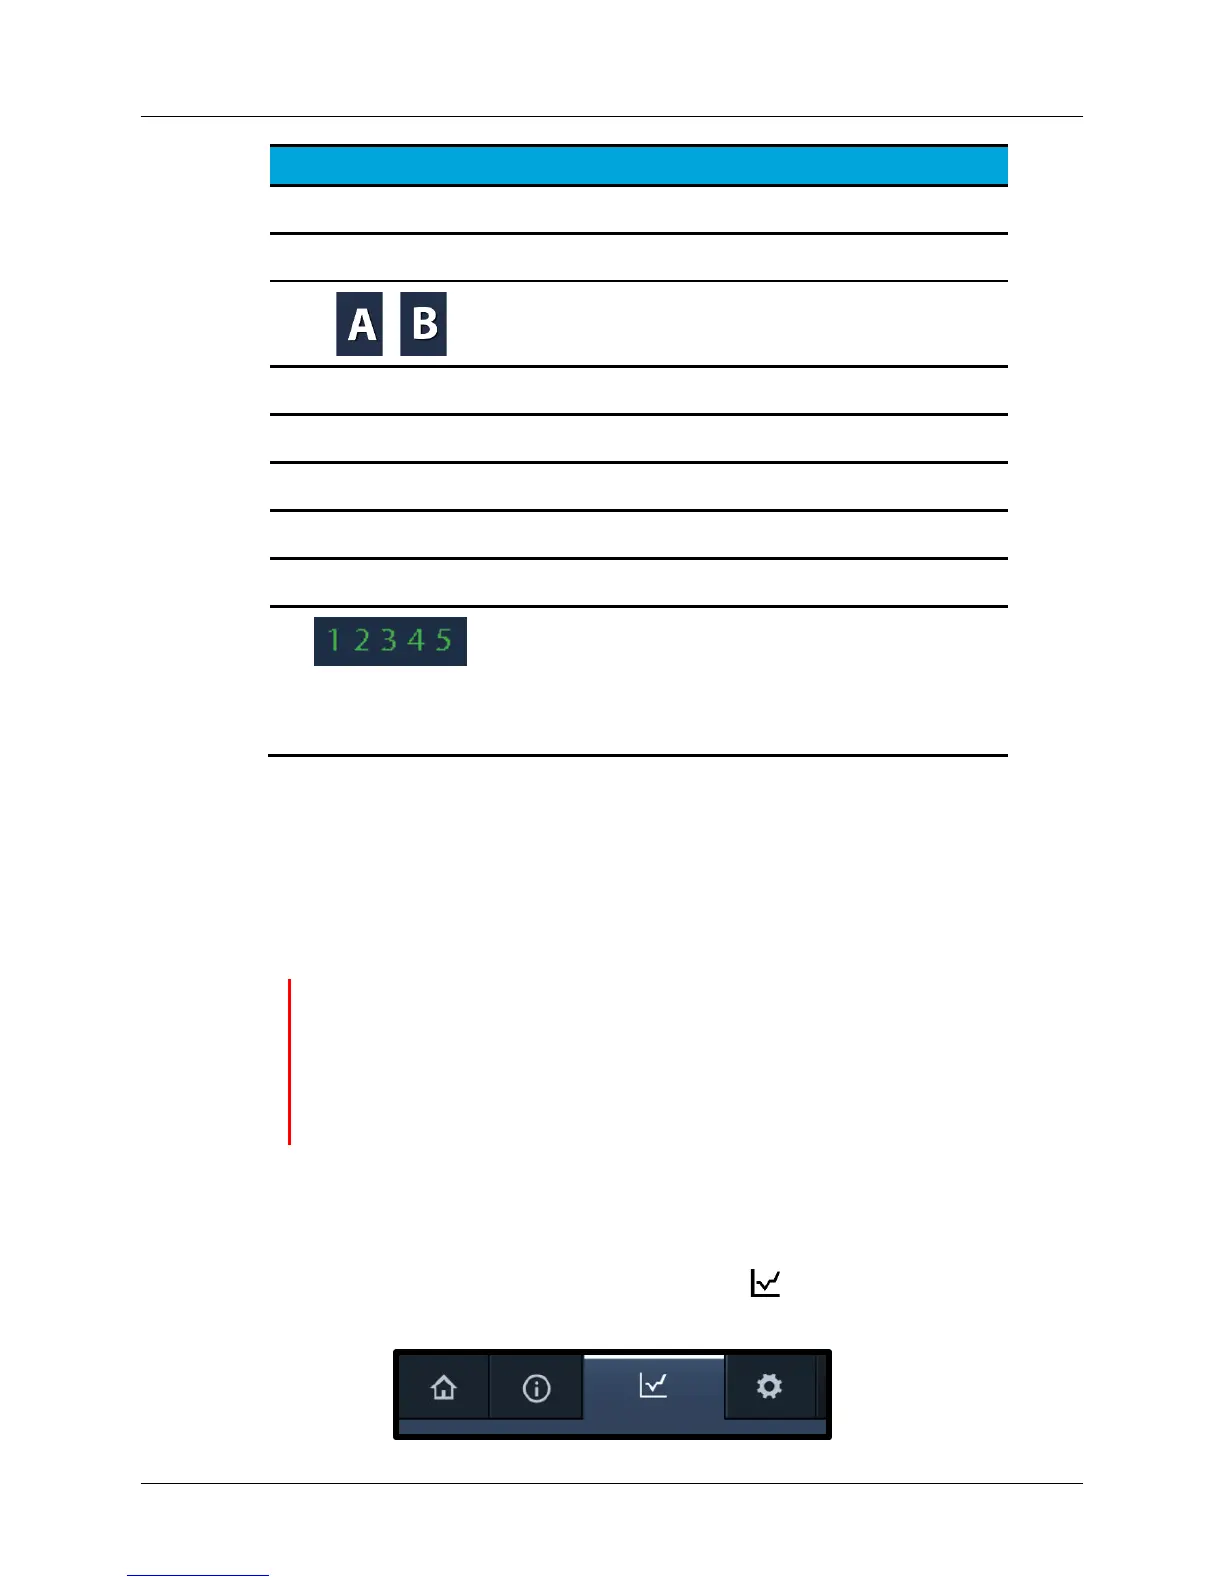
Reading the Power Graph
1. To view the power graph, press the Graph tab on the display (see Figure
35).