Power Graph
46
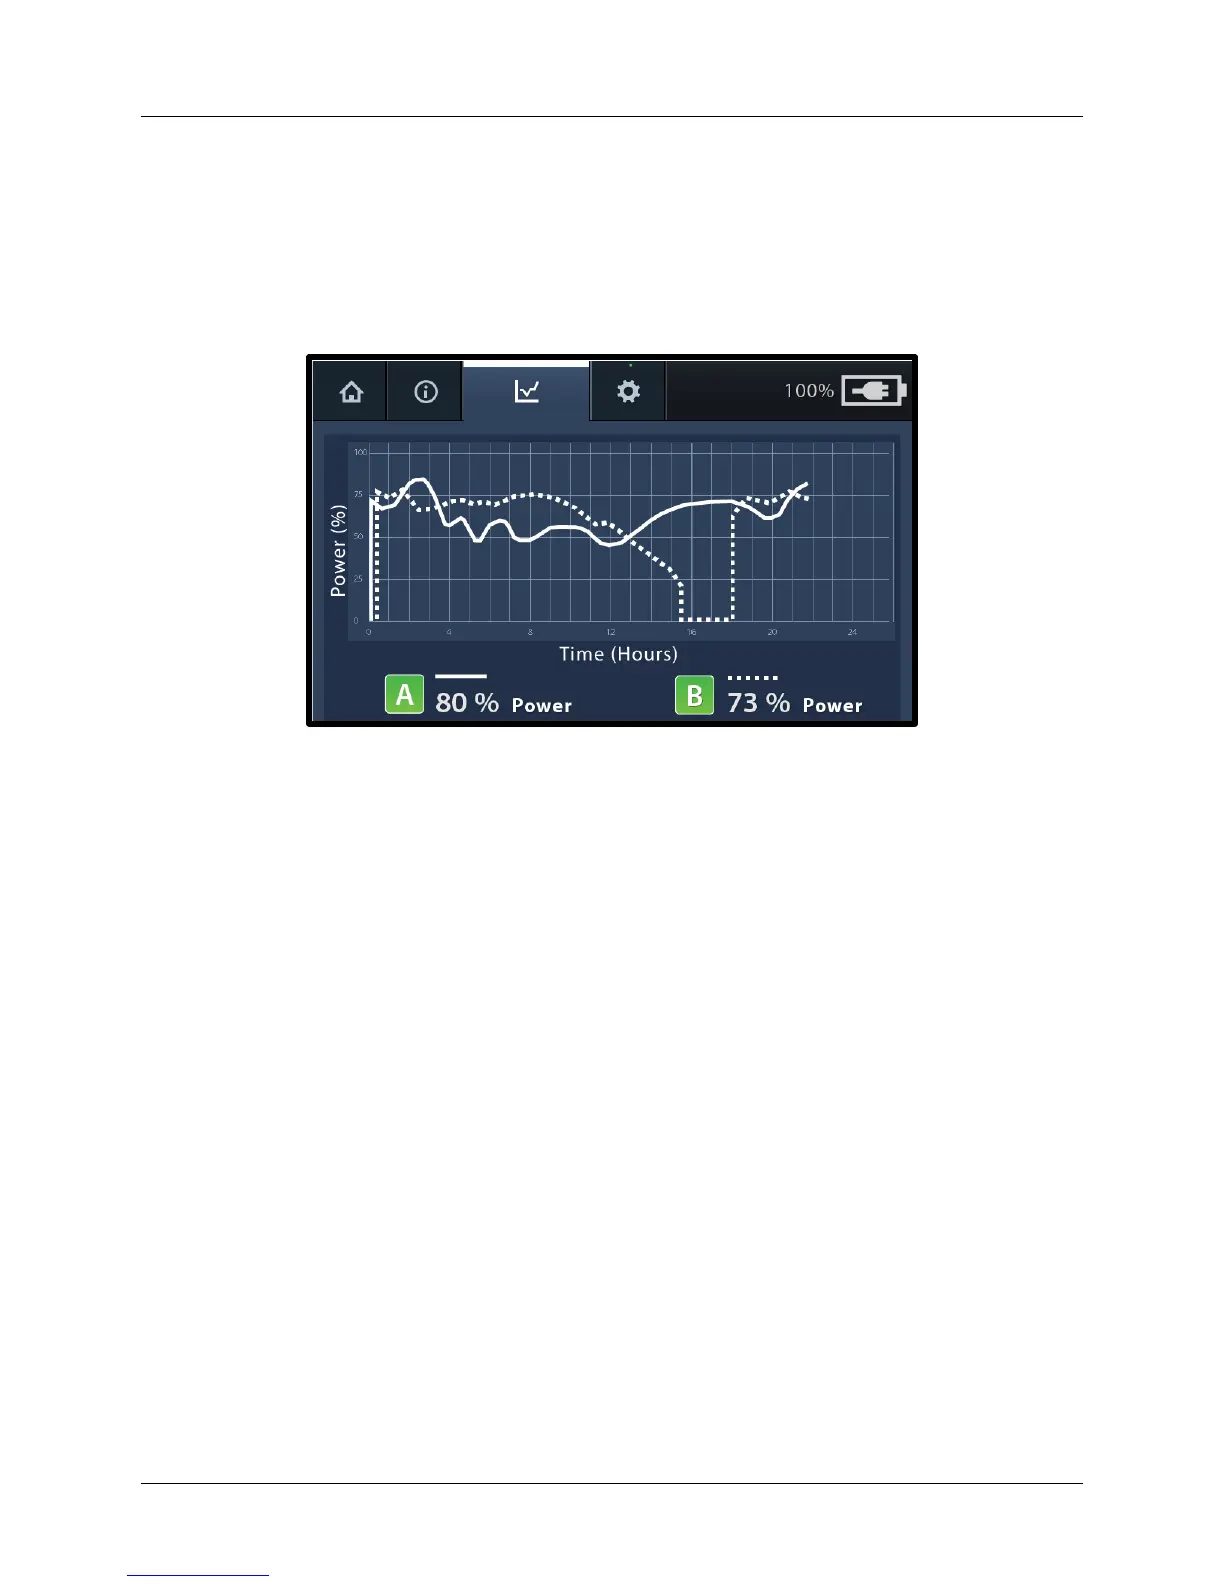
The next power graph screen (Figure 38) shows an example of what is displayed for
two channels when one device is replaced during therapy. For example, one device is
connected to channel A and one device is connected to channel B. Ultrasound therapy
was running for approximately 15.5 hours continuously for both devices, then the device
connected to channel B was replaced with a new device. The new device was
connected to channel B on the Control Unit and ultrasound therapy was restarted.
Figure 38. Example - Two Channel Power Graph, Device Changed
Note: If therapy is stopped for both devices and the devices disconnected from the
Control Unit, it is important to reconnect the devices to the same channel therapy was
started on. If two devices are switched from one channel to another, the runtime will
reflect the total amount of time that specific channel delivered therapy regardless of the
device currently connected.
Snapshot
Every time the Control Unit is turned off and then back on (e.g., turning off for patient
transport) a “snapshot” of the last power graph data will appear on the power graph
screen until therapy is started. To access the snapshot, turn the Control Unit off and
then back on. Then, press the Power Graph tab on the display.
The power graph screen (Figure 39) shows an example of a snapshot power graph. In
this example, the label “snapshot” appears across the graph and both channels have
black icons indicating the channels are ready for ultrasound to start.
Note: It is not possible to download or print the snapshot. Also, upon starting therapy
the snapshot is cleared and active graph data is displayed.