Logging and Charting
23
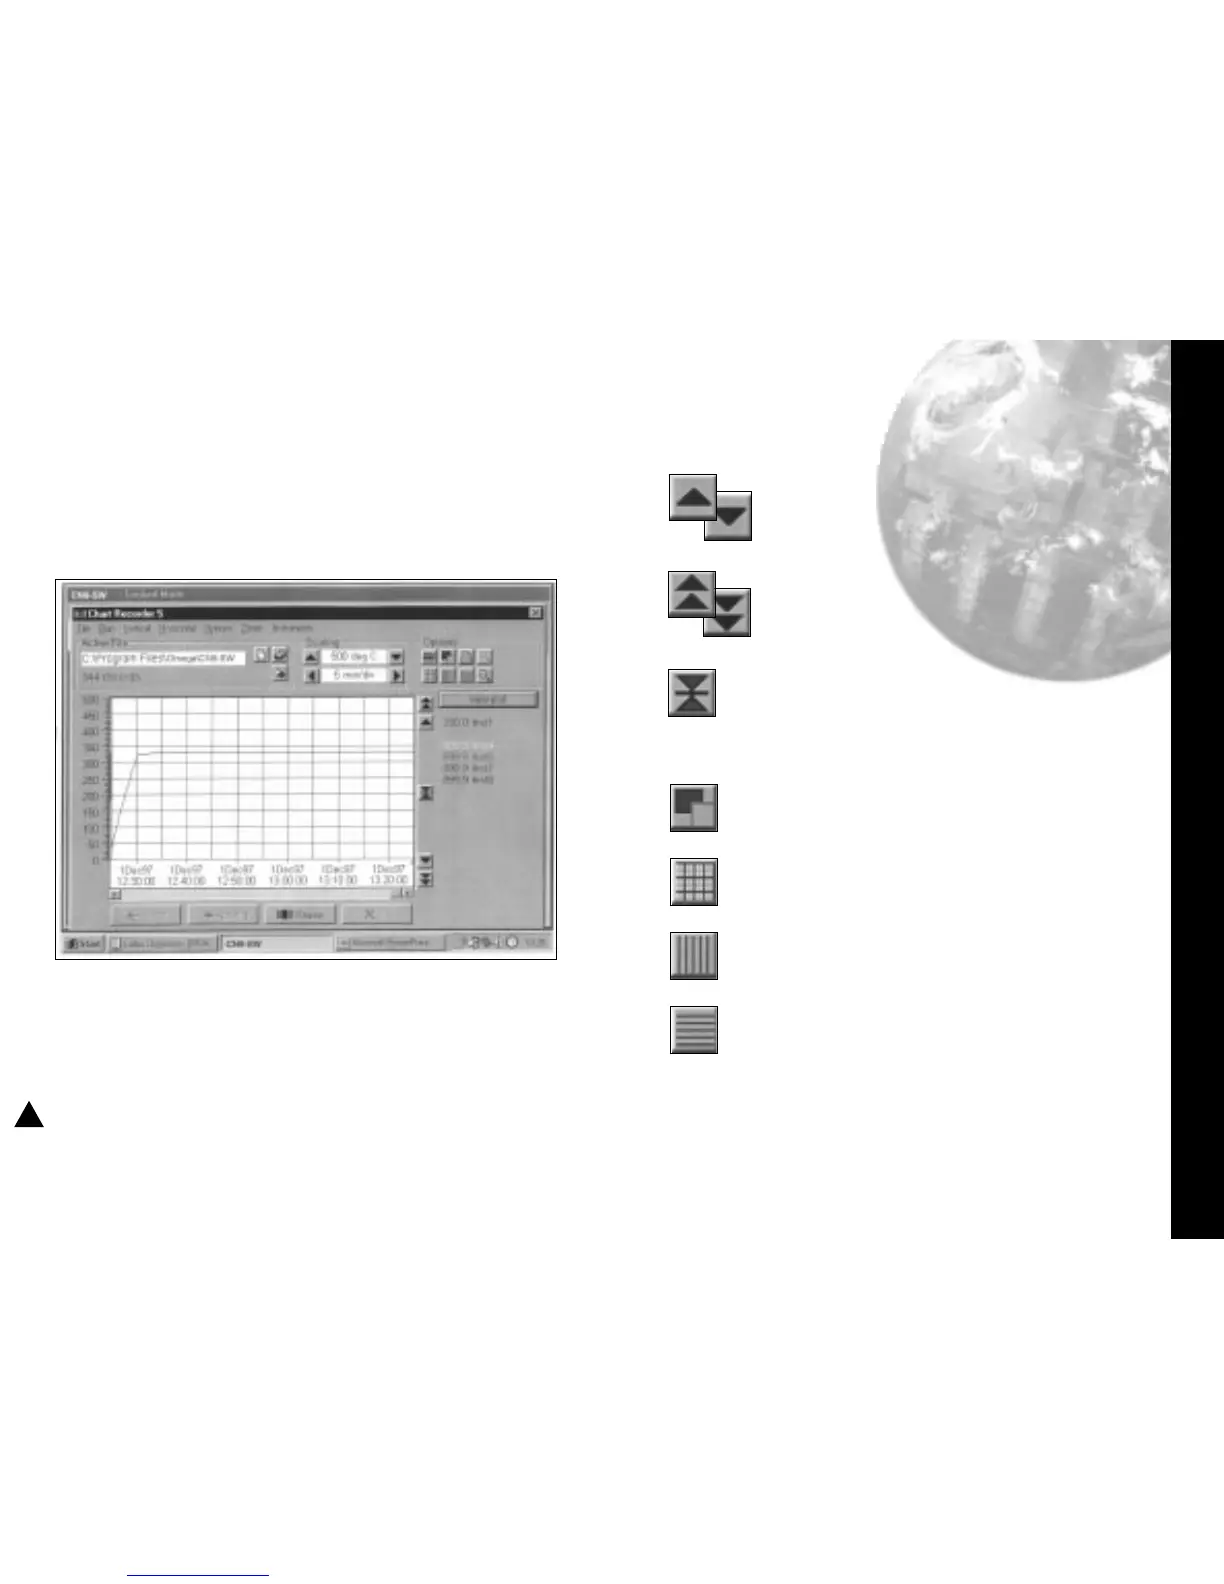
Click the buttons in the deg C/F box to set up
a suitable temperature scale in the chart
Y axis.
Click the buttons in the time/div box to set
chart speed in the time interval per minor
division of the X axis.
Click the Start button to commence logging
and run the chart recorder with default
chart settings.
Note: Chart scale settings are determined by the settings
chosen for the first instrument (or instrument 1)
Traces can be vertically positioned on the chart by using
the chart scroll buttons.
Click the buttons to move the chart up or
down by 10%
Click the buttons to move the chart up or
down by 100%
Click the button to zero the chart
The appearance and colours of the chart can be changed
as follows;
Click select background colour icon, and
chose another colour from the colour
chart.
Click the toggle grid intensity icon to add
minor divisions to the Y axis.
Click the select primary grid colour icon to
change the colour of the grid major
divisions.
Click the select grid colour icon to change
the colour of the grid minor divisions.
Note: Because the chart is re-drawn after each plot, a
setting of less than 5 minutes/div is recommended, to avoid
extravagant use of system resources while logging. Longer
settings can be used to review the full chart history in view
plot mode.