Logging and Charting
24
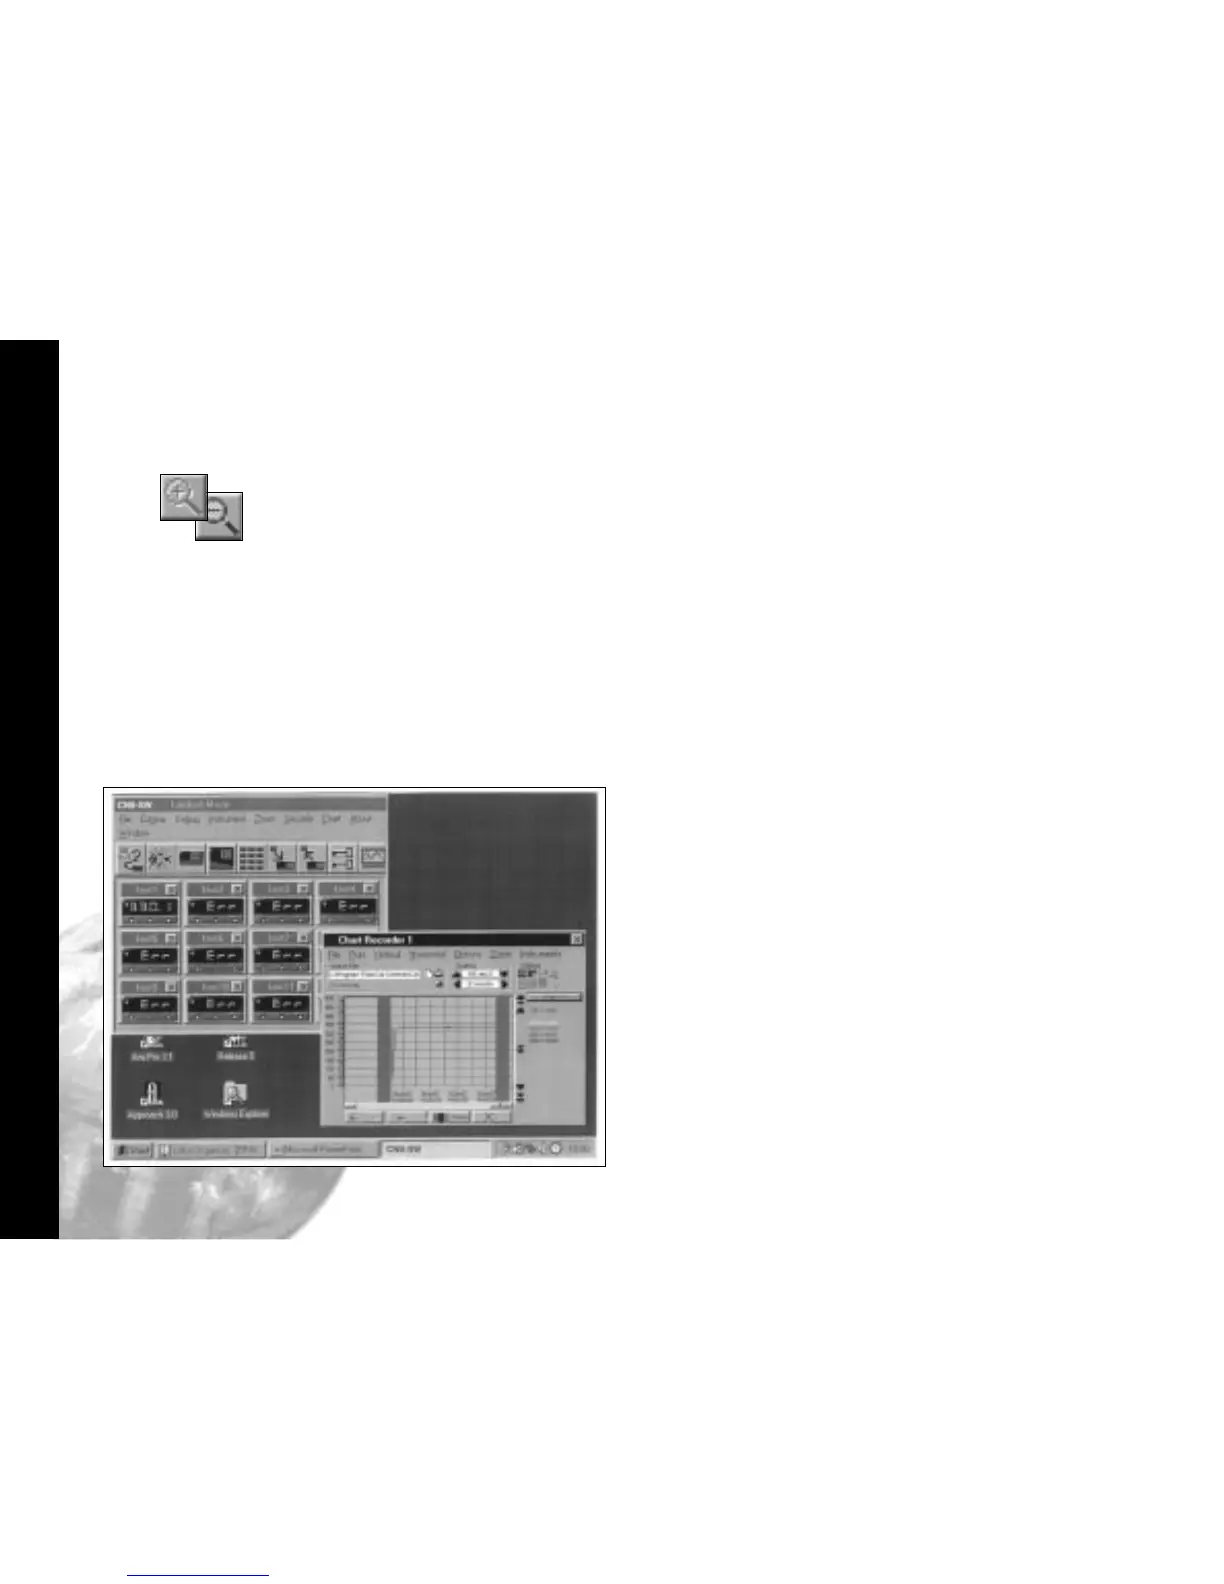
Click the make chart bigger or make chart
smaller icons to adjust the size of the
chart on your screen.
Click in the chart recorder blue title band, and
drag to adjust the position of the chart
recorder on your screen. Repeat this for
the CALCOMMS instrument screen,
and trim both adjustments so that both
are visible.
If you prefer using full screens for both
chart and instruments, toggle between
screens using the instruments menu bar
option in the chart screen and the chart
option in the instruments screen.
Click the pause button to stop logging and
stop the chart recorder.
Click the Resume button to re-start logging
and charting.Note that a grey vertical
band appears on the right of the chart to
signify the break in readings.
Click the auto plot button to pause the chart
and allow the chart history to be viewed
using the horizontal scroll bar controls.
(normal logging continues meanwhile)
Click the view plot button to return to
automatic chart update state and normal
charting is resumed.
During charting, the current value is
displayed to the right of the chart, in the
trace colour. When in view plot mode
Point and Click to any point on the trace. A
dashed vertical line will appear and cut
the trace at this point, and the value will
appear to the right of the chart in place
of the current value.
If used in auto plot mode the reading will
be set to current value at the next plot.