Overview of the Lynx Web Client User Interface
Lynx DSA User's Manual - 9240227J 75
The spectrum is drawn using the plot style defined by the “Plot Type” preference.
There are three styles.
• Line – This style connects each data point using a line.
• Scatter – Draws individual spectral data points.
• Area – This style draws bin-centered bars for each channel.
The data from the spectrum plot is based on the current Input and Group selection.
The Information tab displays information about the data being graphed.
For detailed information, refer to “Spectral Plot” in the Lynx Web Client User's
Manual.pdf.
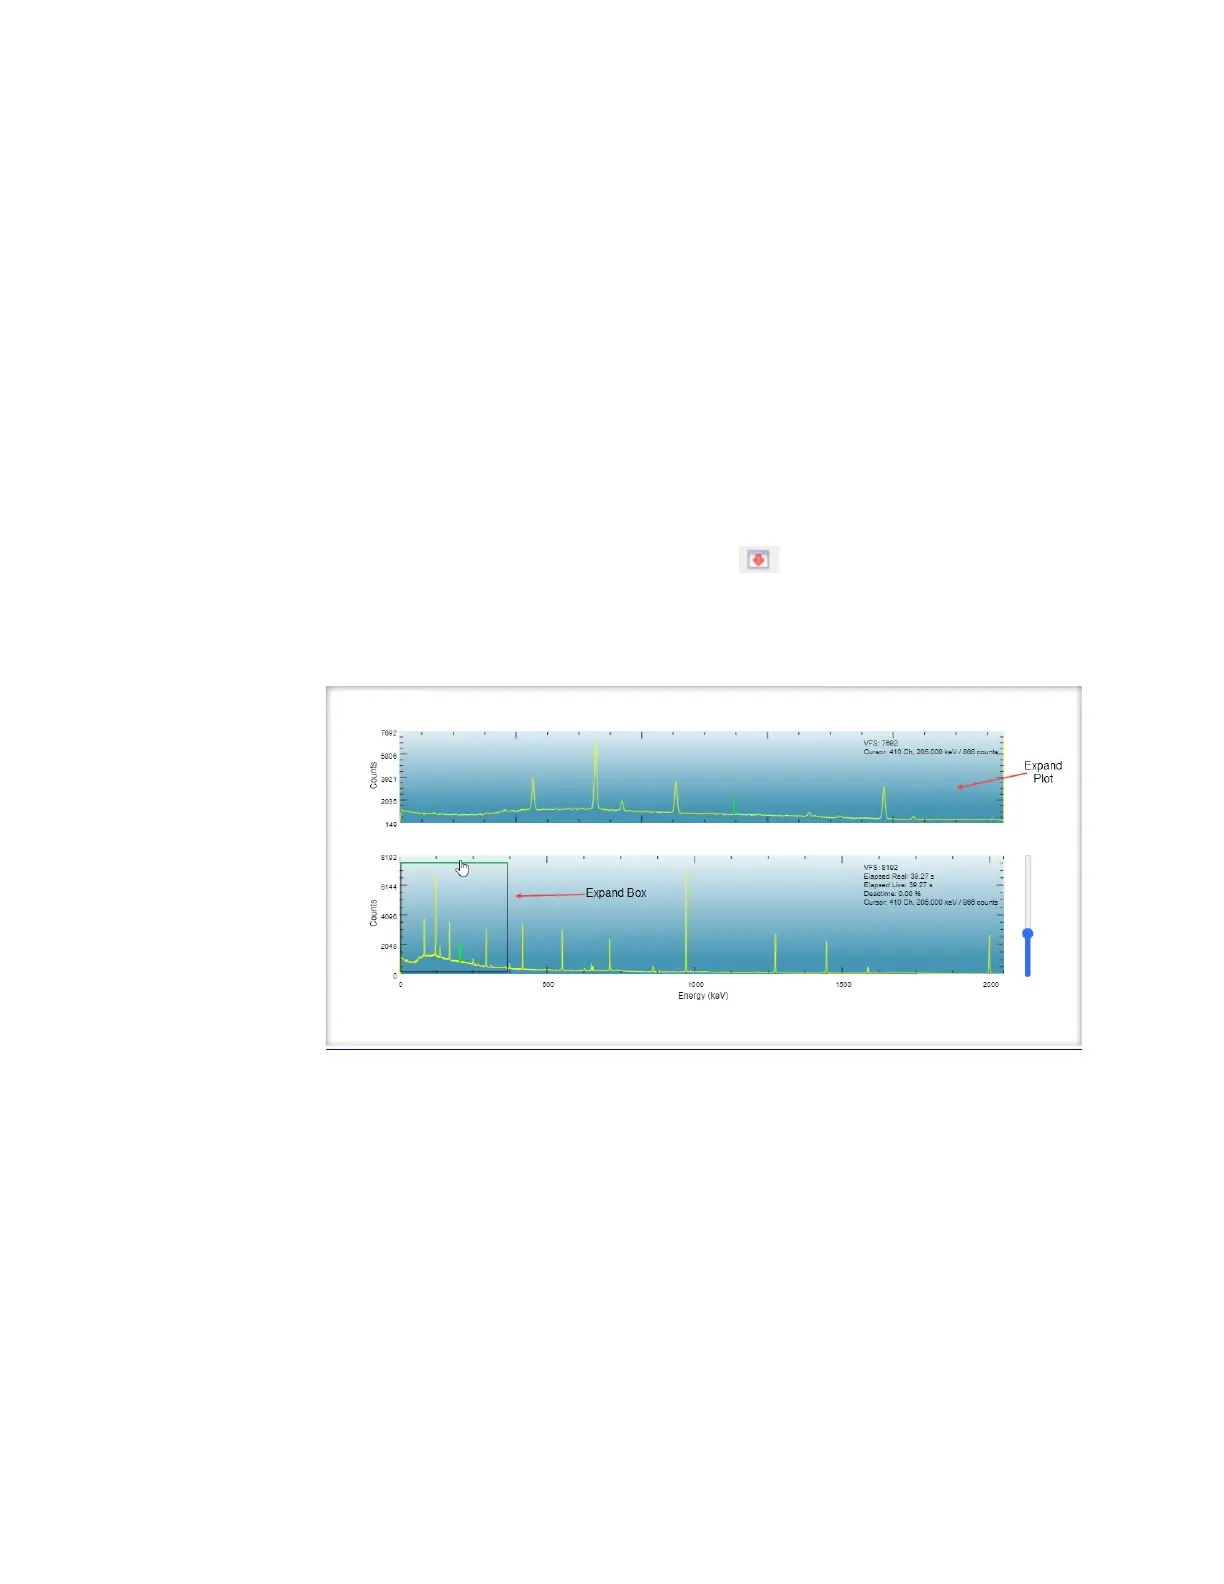
Expanding the Spectrum Data Plot
The icon at the right of the Acquisition Panel., , is used to expand the plot to
show a split-screen display, with the whole spectrum in the lower half of the display
and the expanded portion in the upper half. The expand plot contains a zoomed in
view of the spectral plot below.
Figure 40 A Typical Expanded Display
The expanded half of the display is the data inside the rectangle in the lower half of
the display.
The focus of the expanded display, the rectangle, can be moved through the spectrum
by putting the hand icon inside the rectangle, then clicking and dragging it to a new
location. The data shown in the expanded half of the display will track the moving
rectangle.
The rectangle can be resized by moving the hand icon to any side of the rectangle.
When it changes color, you can move the hand icon and drag the rectangle’s side to a
new height or width.
 Loading...