Chapter 5 Web-Based Operations
76 Lynx DSA User's Manual - 9240227J
Changing the height of the rectangle will automatically rescale the expanded display
to accommodate the data in the rectangle. The normal (unexpanded) display’s VFS
will not change.
Note: The color of the cursor within the expanded box is determined by Preference
| Miscellaneous | Cursor Color.
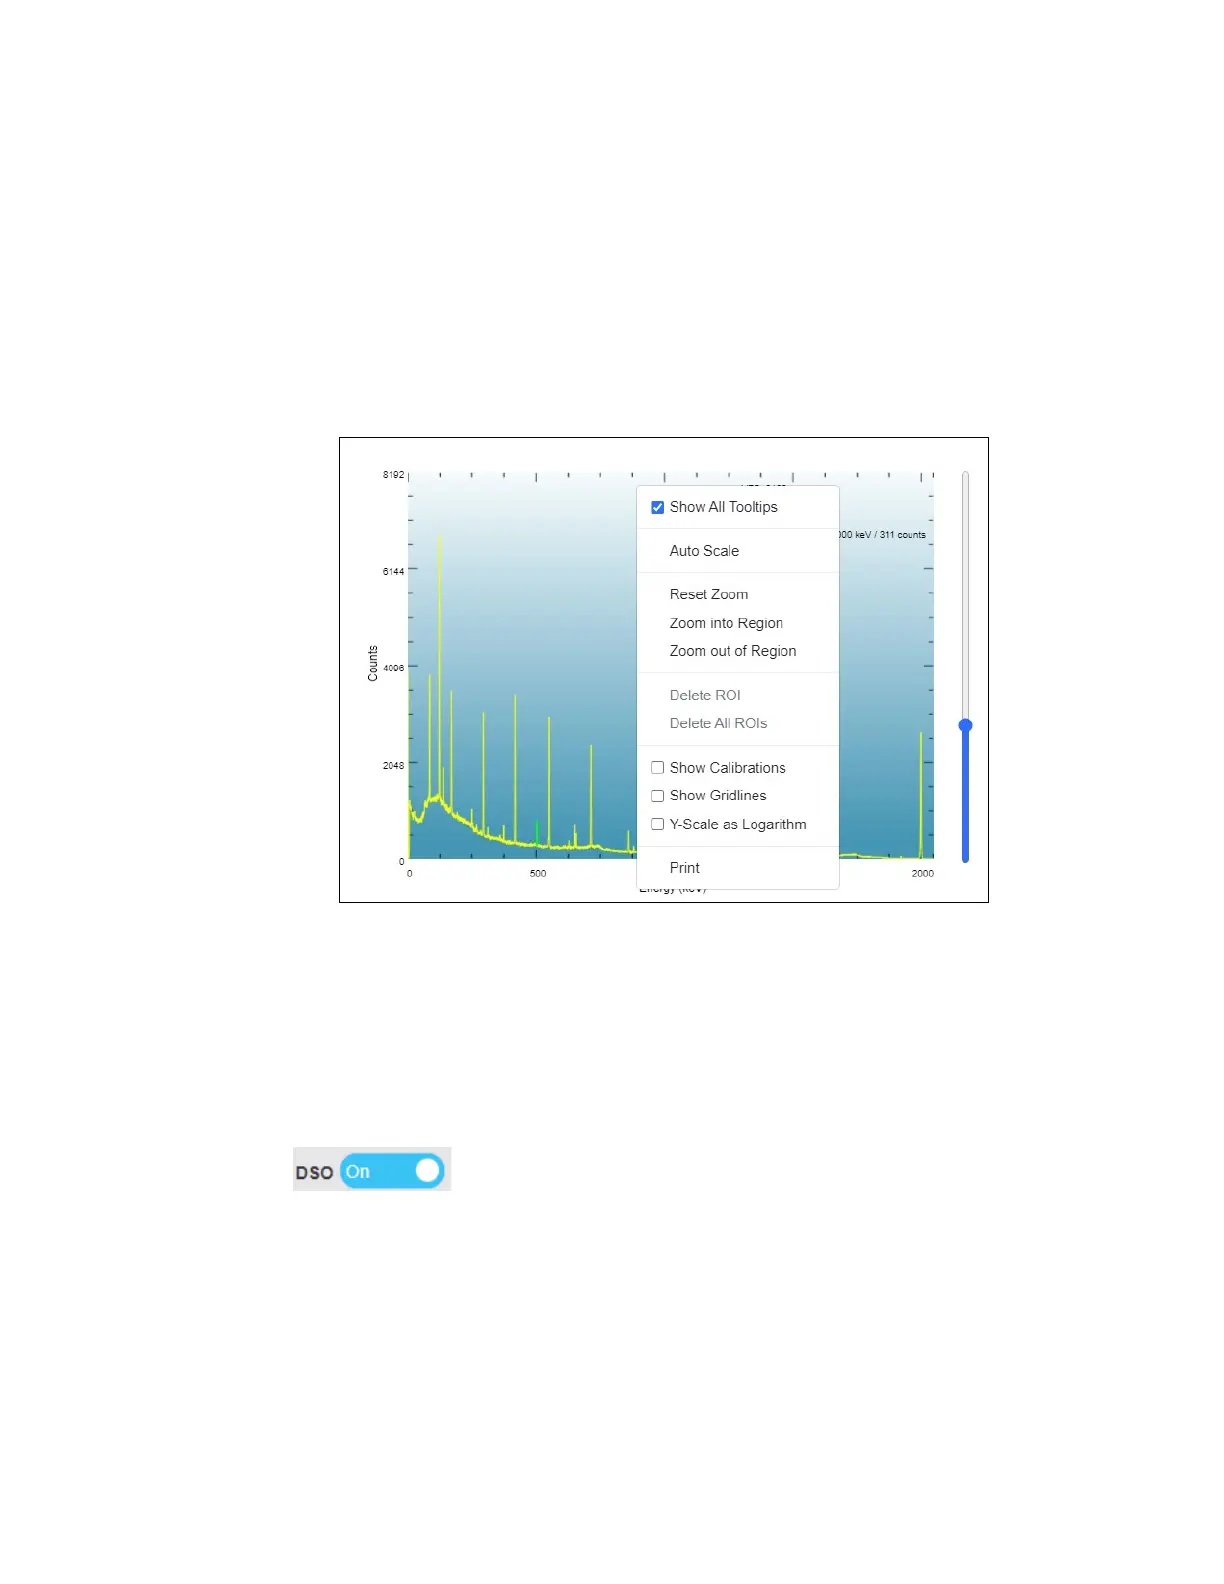
Spectrum Context Menu
Right-clicking on the spectral data plot brings up a Context Menu of items for
rendering the spectral data. Refer to Web Client User’s Manual for full details.
Figure 41 Context Menu
Digital Oscilloscope Plot
The Lynx incorporates an oscilloscope (DSO) which allows examination of the
digital signal reconstructed in time to assist and verify instrument setup, pole/zero
optimization and manual Reset Preamp Inhibit adjustments.
The DSO Plot is activated by selecting the DSO button to “On” position
( ) located in the vicinity of the upper right corner of the graph area.
The operator has the ability to view any one of six analog signals on the same screen
as well as any combination of the eight supported digital signals. Any one of the
digital signals may be used as the Trigger. Trigger options also include Continuous,
Manual or Single with both Trigger and Arm control.
Each digital signal waveform is displayed in different colors to distinguish between
the multiple traces. The waveform can be printed to a printer, depending on the
capabilities of your printer and the Internet browser you have chosen.
 Loading...