19990401
5-2-8
Controlling What Appears on a Graph Screen
#You must specify two different points for box
zoom, and the two points cannot be on a straight
line vertically or horizontally from each other.
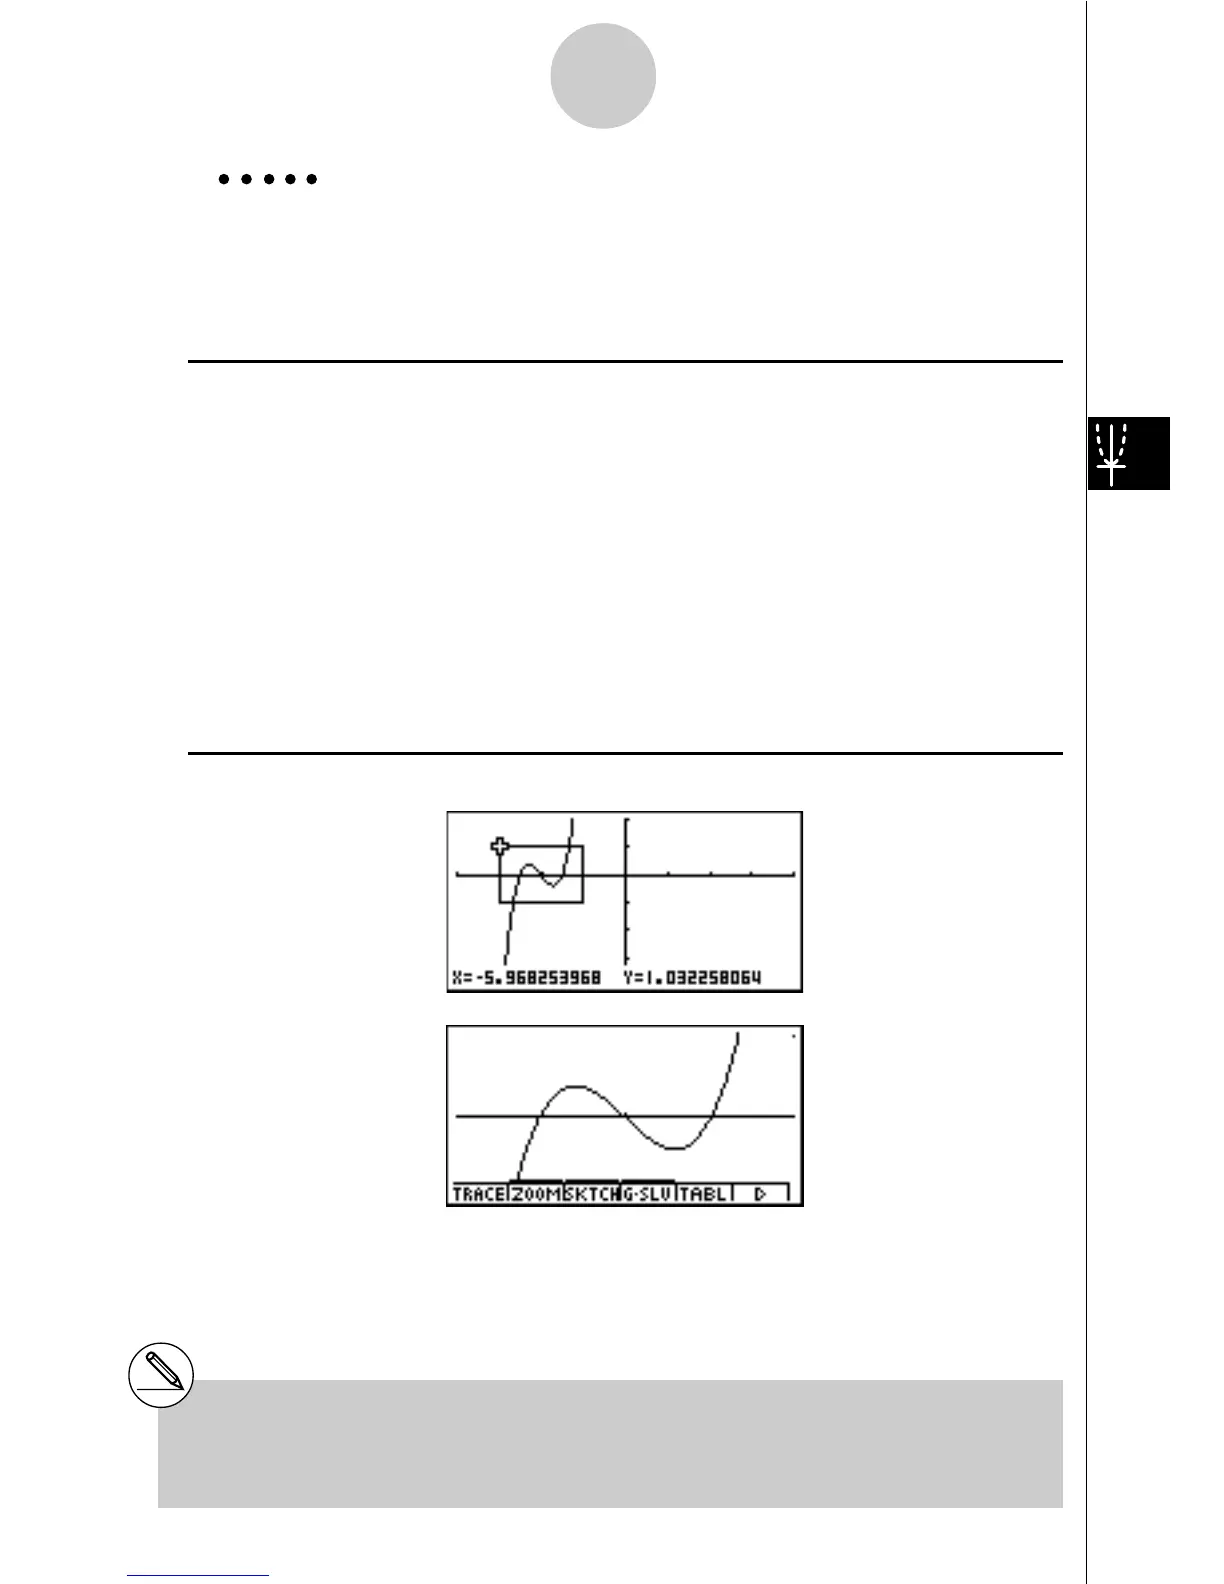
Example Graph y = (x + 5)(x + 4)(x + 3), and then perform a box zoom.
Use the following V-Window settings.
Xmin = –8, Xmax = 8, Xscale = 2
Ymin = – 4, Ymax = 2, Yscale = 1
Procedure
1 m
GRPH
•
TBL
!K(V-Window) -iwiwcwc
-ewcwbwi
3(TYPE)b(Y=)(v+f)(v+e)
(v+d)w
5(DRAW)
2 2(ZOOM)b(Box)
3 d~dw
4 d~d,f~fw
Result Screen