1. Enter the bivariate data into the two lists, as shown in
the last section.
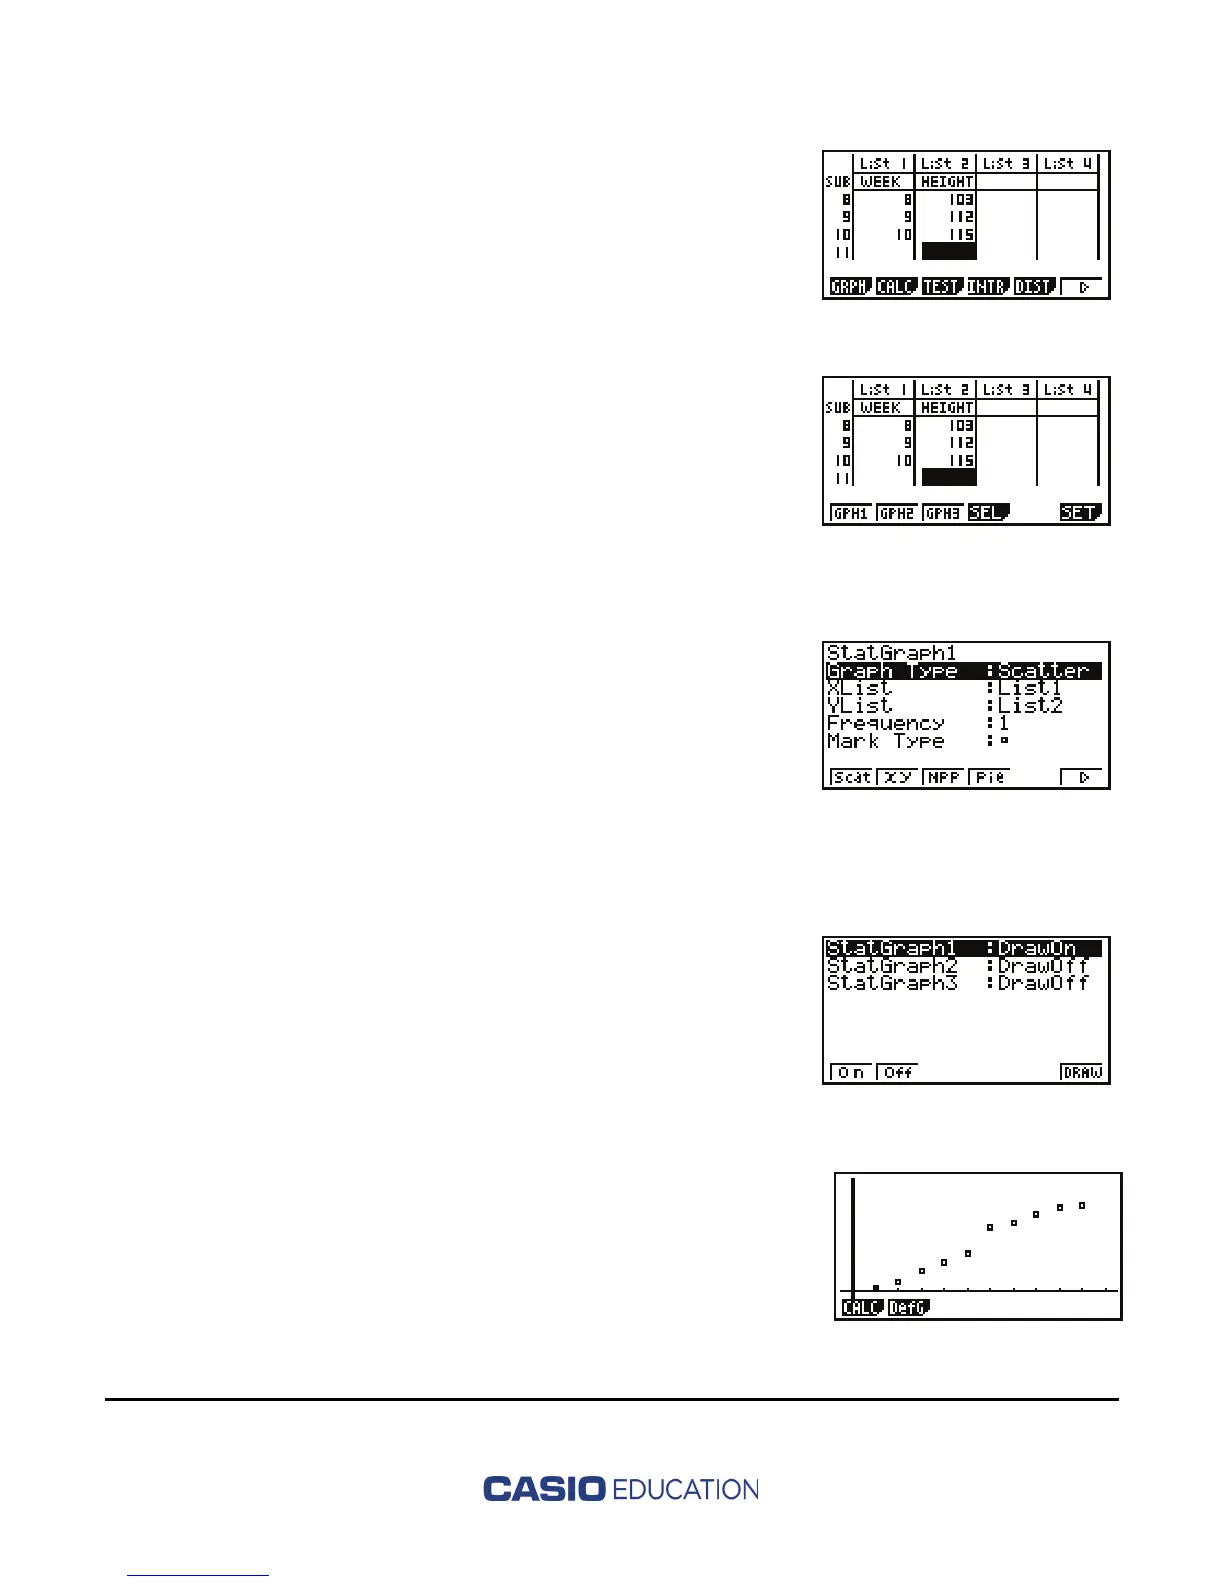
2. Press q(GRPH). (If q is TOOL instead of GRPH,
press u(
>
) first.)
3. Press u(SET). Scroll down to highlight Graph Type
and press q(Scat). Scroll down to XList, YList,
Frequency, and Mark Type, if necessary, to change to
the settings pictured on the right. Press d to return
to the previous screen.
4. Press r(SEL). Only StatGraph1 should be turned on.
If necessary, highlight the desired StatGraph and press
q(On) or w(Off) to change.
5. Press
u(DRAW).

 Loading...


