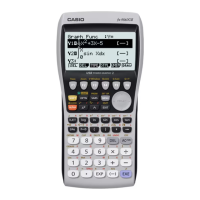
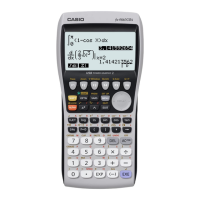
3. Press u(SET). Set Graph Type to be Scatter by
pressing N, then q(Scat). Use the keypad and q(:)
to set the XCellRange to include all of the column A cells,
and the YCellRange to include all of the column B cells.
Refer to the screen shot on the right.
4. Press d to return to the previous screen. Press q
(GPH1).
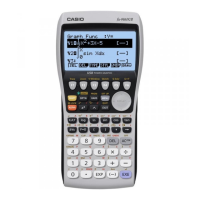
(3b) How to graph a function over a scatter plot using the Casio fx-9860GII
1. Using the scatter plot from the last section, press
w
(DefG).
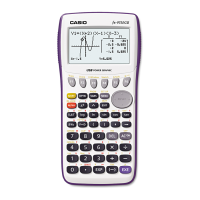
2. Enter the desired function, and press u(DRAW).
 Loading...


