____________________________________________________________________
(2c#9 on worksheet)
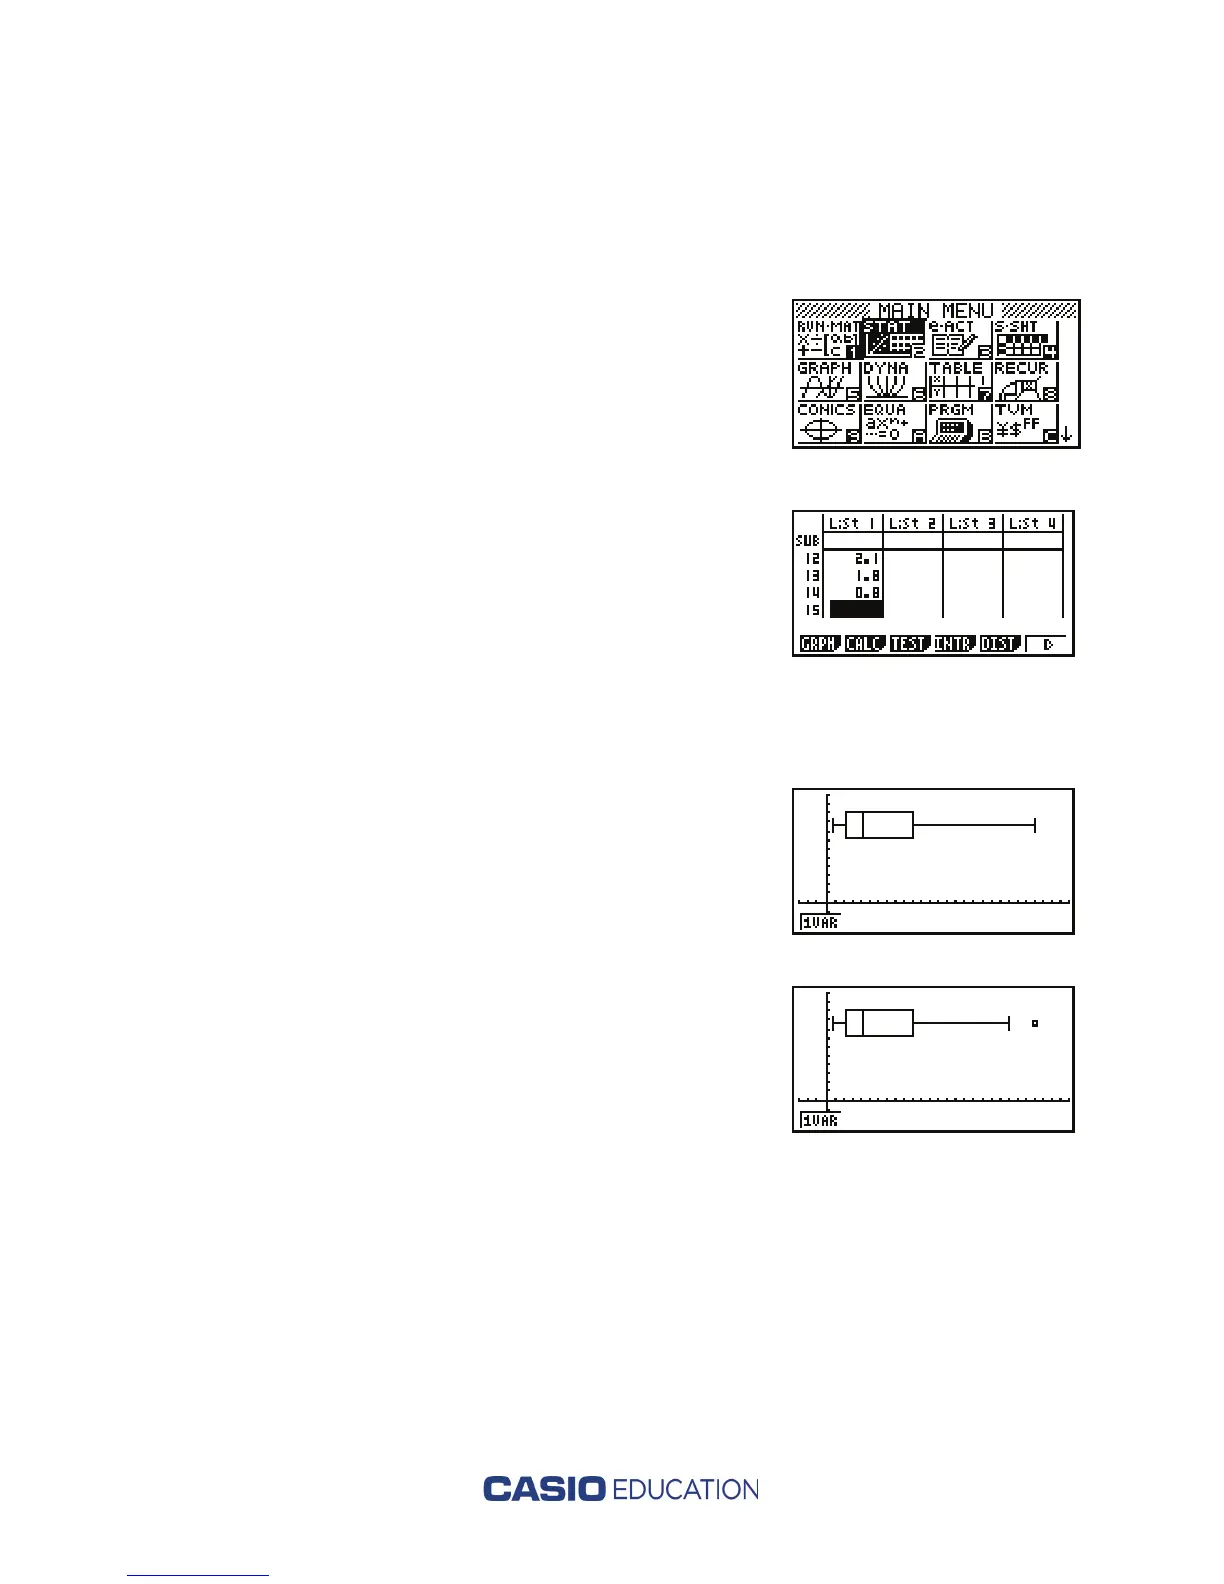
How to construct a box plot with and without outliers
1. From the main menu, highlight the STAT icon
and press
l. If any list contains data, highlight
any entry in the list and then press
u( ), >
r(DEL-A), then q to delete all entries in that
list. Repeat for each list containing data.
2. Enter the PPG data into List 1, pressing l
after each entry.
3. Press q(GRPH), then u(SET). Scroll down one
line to Graph Type and press u(
>
), then w(Box).
Scroll down to Outliers and press w(Off) to
construct the box plot without outliers. (Press
q(On) to construct the box plot with outliers.)
Press d to return to the previous screen, then
q(GPH1). The first screen shot on the right
displays the box plot without outliers. The second
screen shot displays the box plot with outliers.
____________________________________________________________________
How to display two box plots using the same screen.
Using the same data as above, both the box plot with outliers and the box plot without
outliers will be displayed on the same screen.

 Loading...


