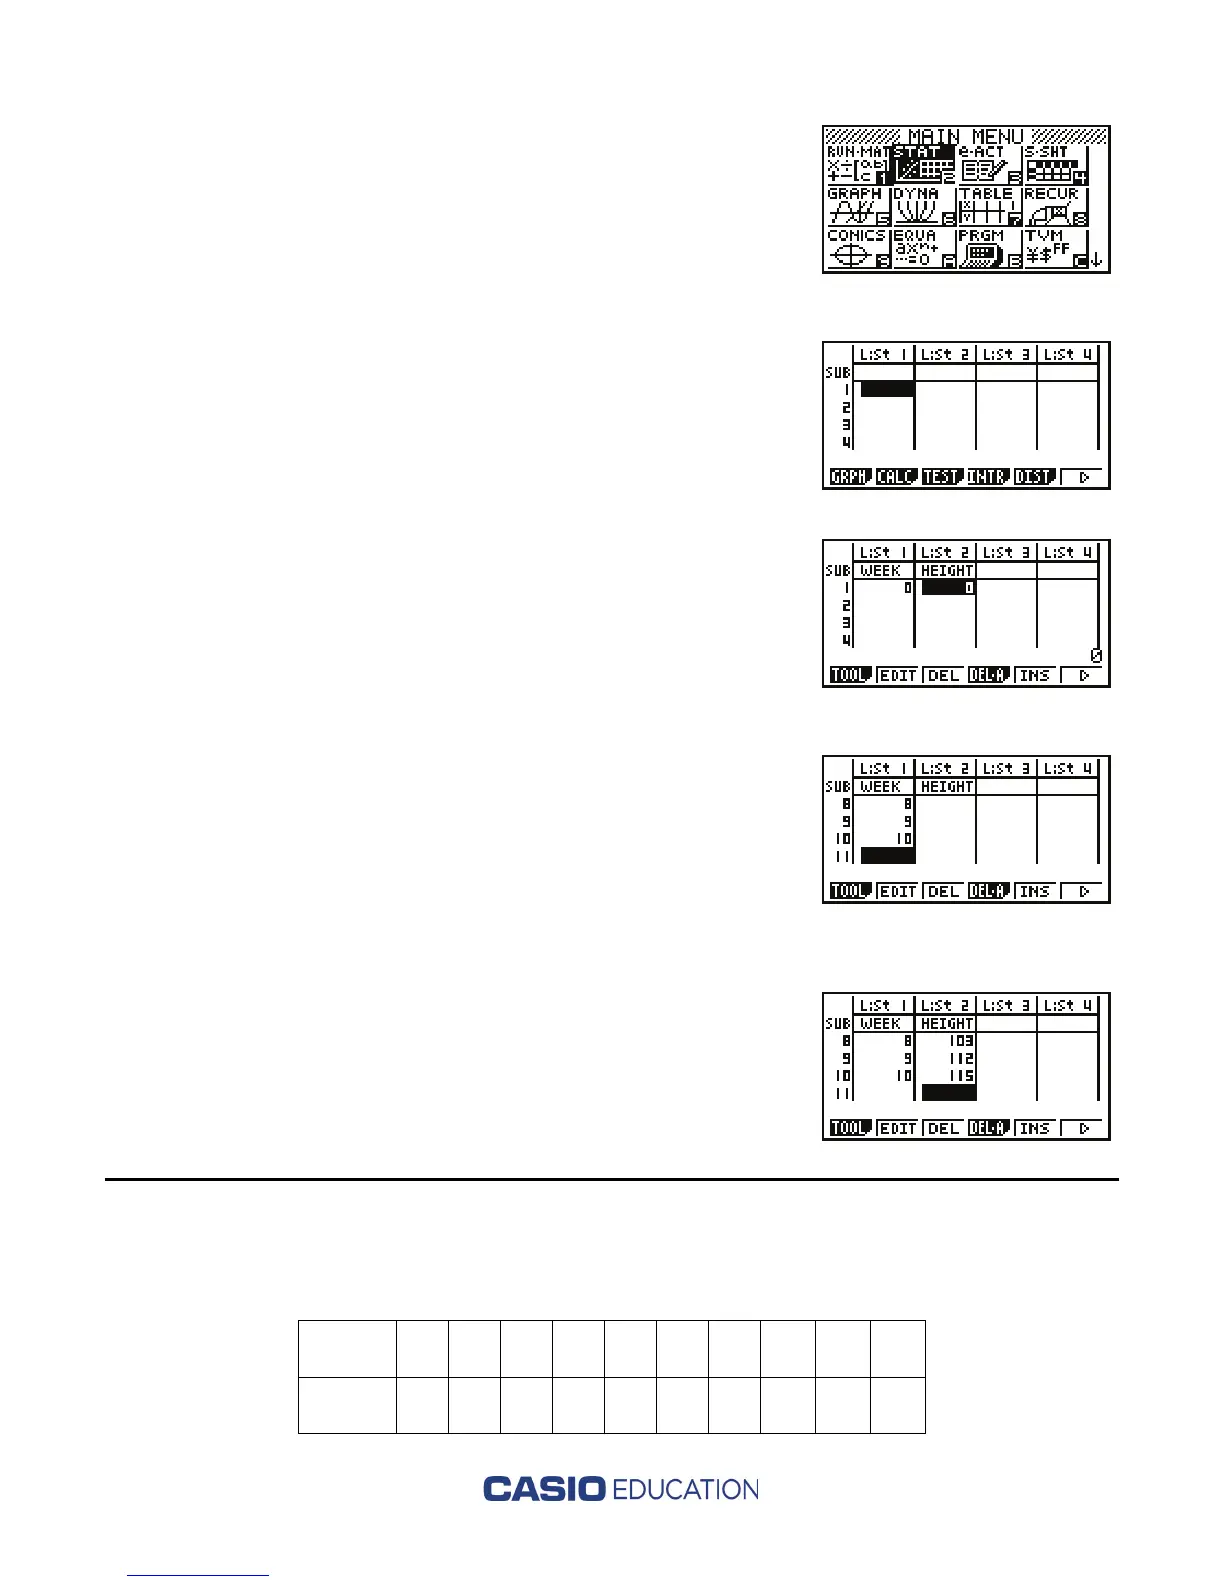
1. From the main menu, highlight the STAT icon
and press l. If any list contains data, highlight
any entry in the list and then press u( ), >
r(DEL-A), then q to delete all entries in that
list. Repeat for each list containing data. Press u(
>
)
to return to original menu options.
2. When all lists are cleared, title each column using the
labels from the table. Press B to scroll to the SUB
row. Then press
La(A-LOCK) to activate
Alpha-lock. Using the red letters at the top right of
each key, type the titles. Press
l after typing each
title. Only 6 characters may be used for each title.
Press $ B and repeat these steps for the second
column.
3. Press ! to highlight the first entry in List 1 and enter
the numbers for week from the table above. Press
l after each entry.
4. Scroll to the right by pressing
$to get to the next list.
Enter each height into List 2. Press l after each entry.
(1b) How to graph a scatterplot using the Casio fx-9860GII
Use the same data:
WEEK 1 2 3 4 5 6 7 8 9 10
HEIGHT 5 12 26 39 51 88 94 103 112 115

 Loading...


