(2d) How to construct a line graph using the Casio fx-9860GII
Year PPI Year PPI
1940 13.5 1976 61.1
1944 17.9 1980 89.8
1948 27.7 1984 103.7
1952 29.6 1988 106.9
1956 30.3 1992 117.2
1960 31.7 1996 127.7
1964 31.6 2000 132.7
1968 34.2 2004 146.7
1972 39.8 2008 189.7
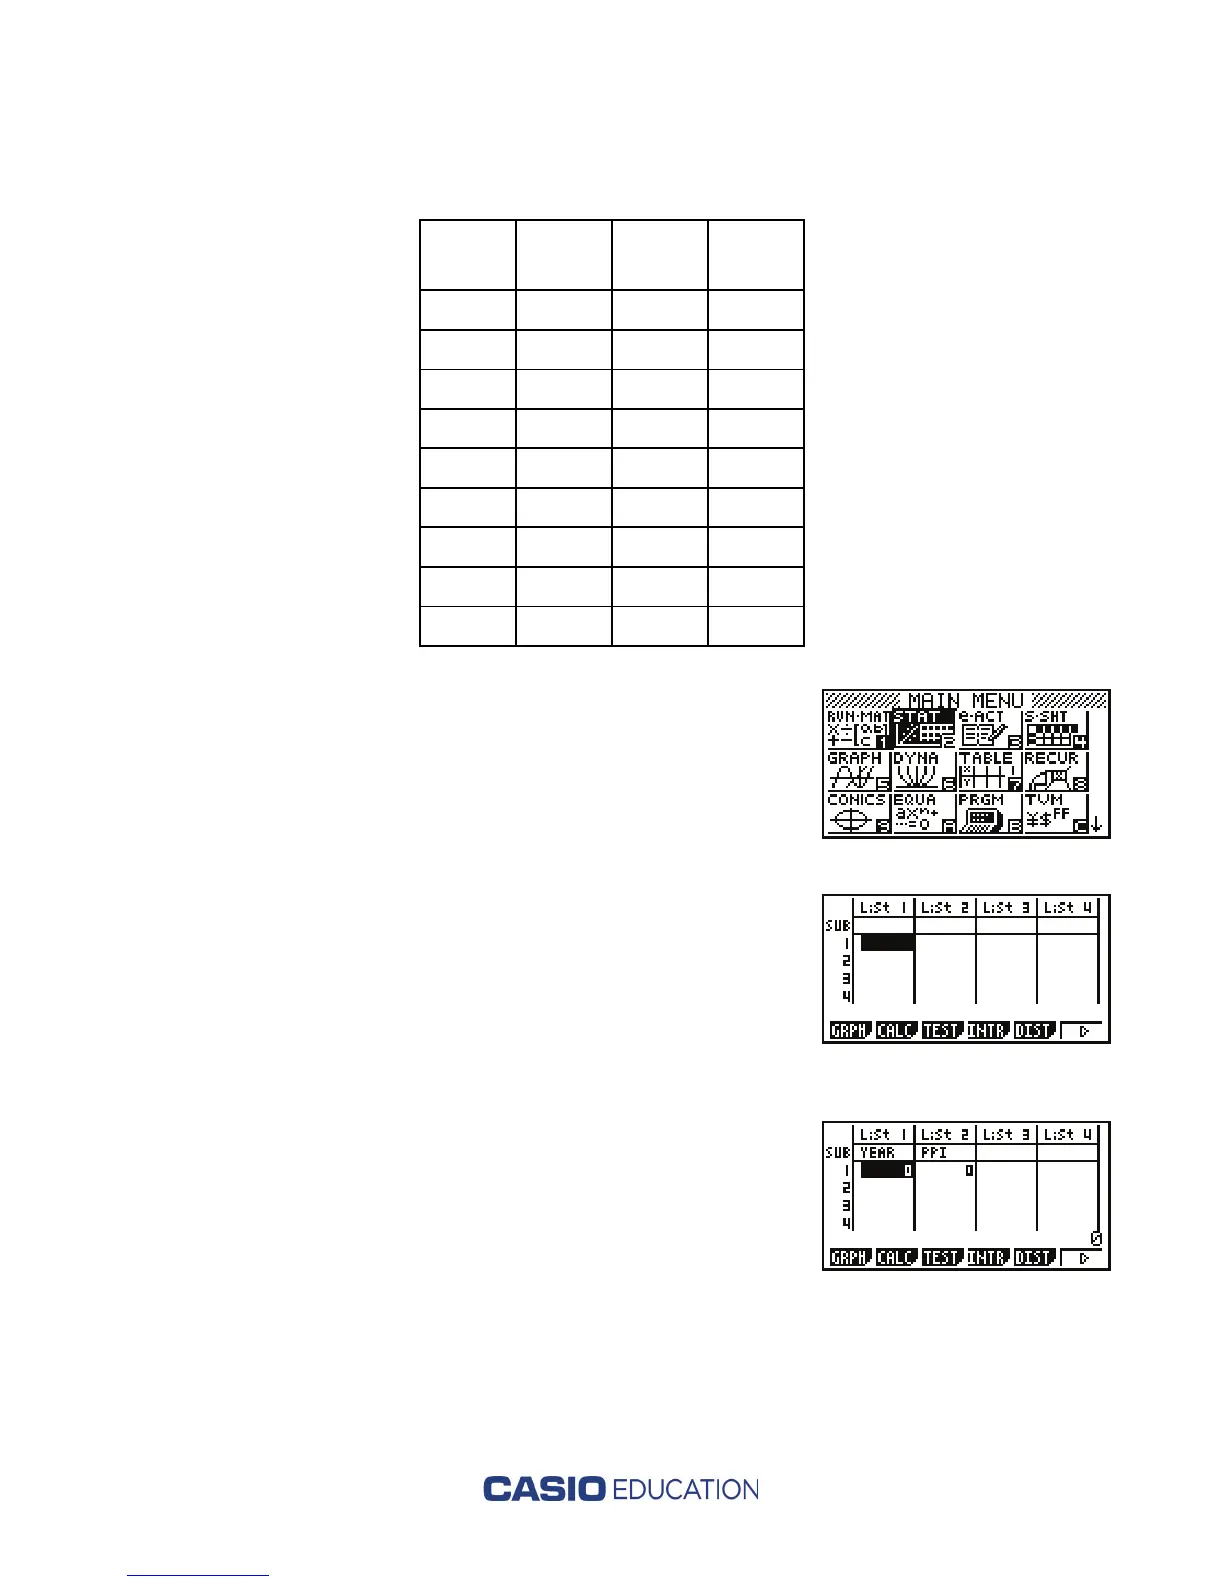
1. From the main menu, highlight the STAT icon
and press l. If any list contains data, highlight
any entry in the list and then press u( ), >
r(DEL-A), then q to delete all entries in that
list. Repeat for each list containing data. Press u(> )
to return to original menu options.
2. When all lists are cleared, label List 1 as YEAR and
List 2 as PPI by first pressing
B to scroll to the
SUB row. Then press La(A-LOCK) to activate
Alpha-lock. Using the red letters at the top right of
each key, type the titles. Press
l after each title.

 Loading...


