1. From the main menu, highlight the STAT icon
and press l. If any list contains data, highlight
any entry in the list and then press u( ), >
r(DEL-A), then q to delete all entries in that
list. Repeat for each list containing data.
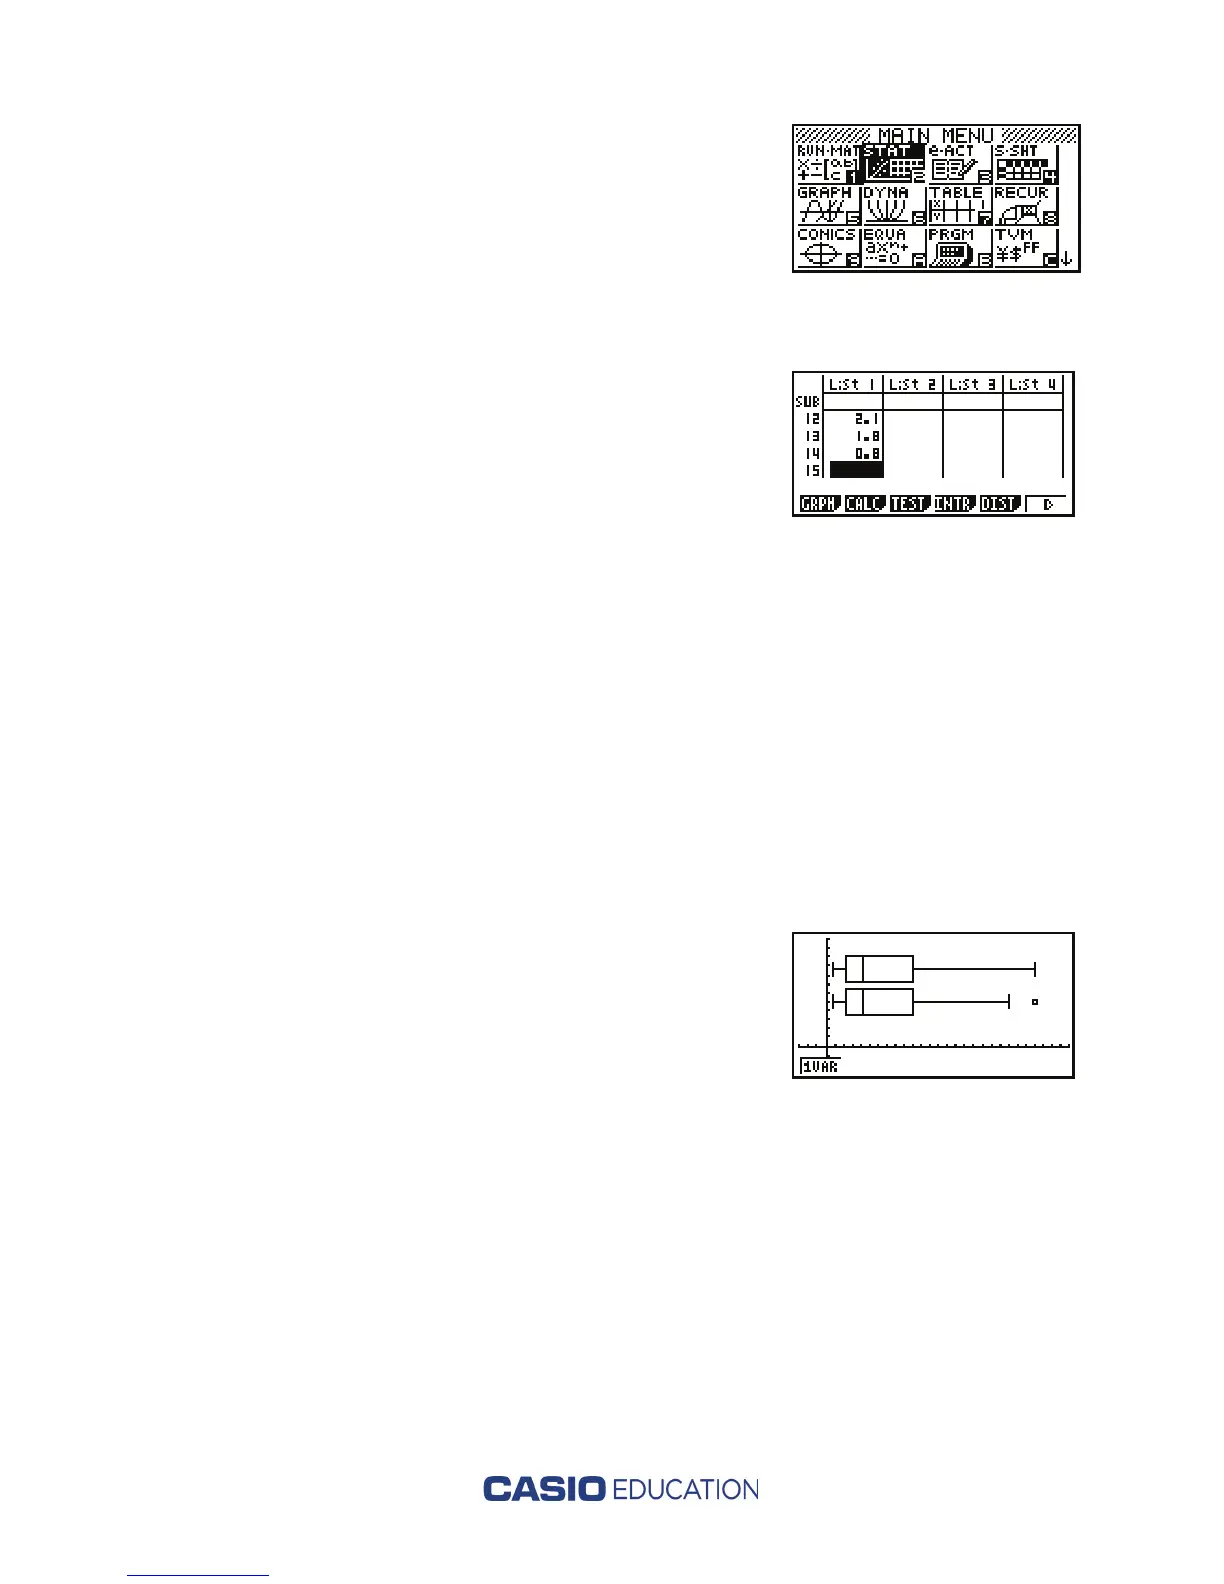
2. Enter the PPG data into List 1, pressing l
after each entry.
3. Press
q(GRPH), u(SET), then q(GRPH1). Scroll
down one line to Graph Type and press
u(> ),
w
(Box). Scroll down to Outliers and press w(Off)
to construct the box plot without outliers. Press d
to return to the previous screen. Press u(SET),
w(GRPH2). Scroll down one line to Graph
Type and press u(> ), then w(Box). Scroll down
to Outliers and press q(On) to construct the box plot
with outliers. Press d to return to the previous
screen. Press
r(SEL), then press q to turn
StatGraph1 on. Scroll down one place and press
q
to turn StatGraph2 on. Press
u(DRAW).
____________________________________________________________________
(2b) How to save to document on classroom computer.
1. Download the FA-124 Program-Link software to the computer before connecting the
calculator to the computer. The software and cable came packaged with the Casio
fx-9860GII calculator. Connect the calculator to the computer using the cable
provided. Once connected, a connection mode screen will appear on the calculator.
Select DATA TRANSFER: [F1]. The following screen will appear on the computer.

 Loading...


