5-9
Example Graph y = ( x + 5)( x + 4)( x + 3), and then perform a box zoom.
Use the following V-Window settings.
Xmin = –8, Xmax = 8, Xscale = 2
Ymin = –4, Ymax = 2, Yscale = 1
1 m Graph
!3(V-WIN) -iwiwcwc
-ewcwbwJ
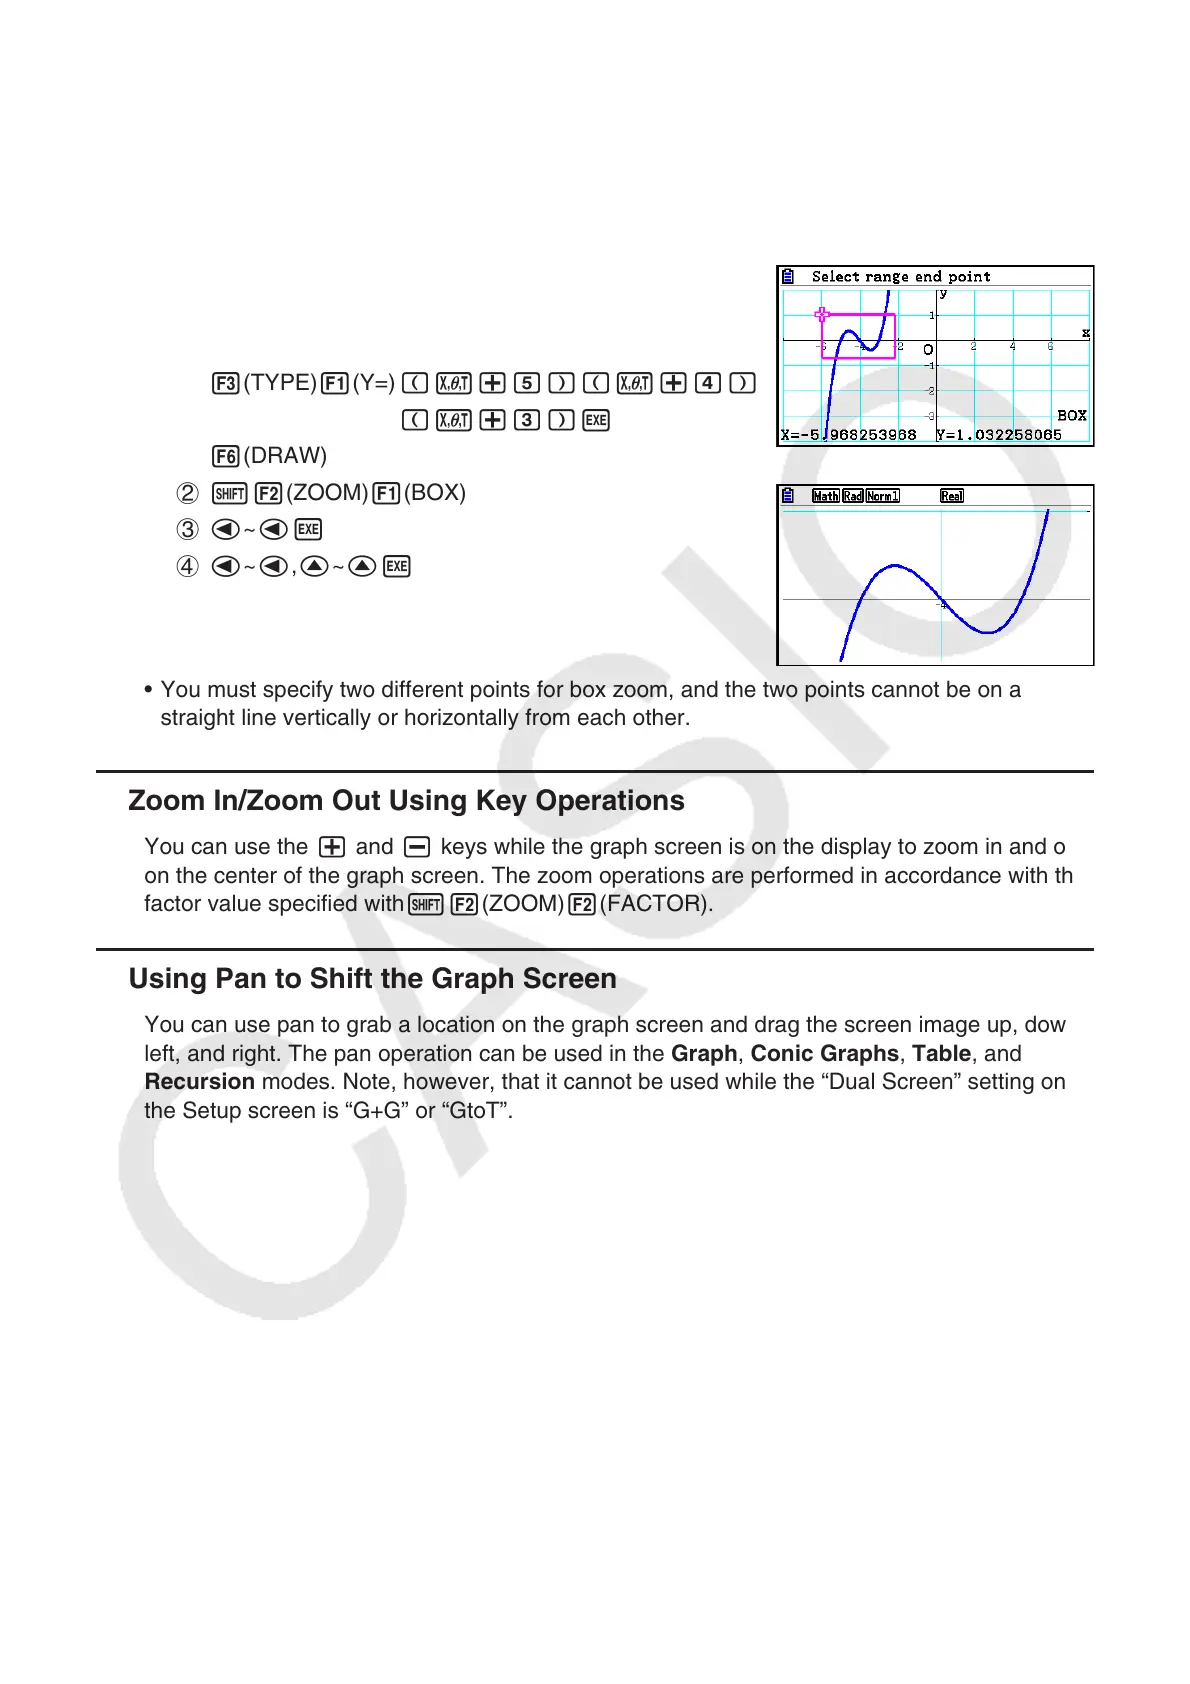
3(TYPE) 1(Y=) (v+f)(v+e)
(v+d)w
6(DRAW)
2 !2(ZOOM) 1(BOX)
3 d~ dw
4 d~ d, f~ fw
• You must specify two different points for box zoom, and the two points cannot be on a
straight line vertically or horizontally from each other.
k Zoom In/Zoom Out Using Key Operations
You can use the + and - keys while the graph screen is on the display to zoom in and out
on the center of the graph screen. The zoom operations are performed in accordance with the
factor value specified with!2(ZOOM)2(FACTOR).
k Using Pan to Shift the Graph Screen
You can use pan to grab a location on the graph screen and drag the screen image up, down,
left, and right. The pan operation can be used in the Graph, Conic Graphs, Table, and
Recursion modes. Note, however, that it cannot be used while the “Dual Screen” setting on
the Setup screen is “G+G” or “GtoT”.