5-15
u To assign values to the coefficients and variables of a graph function
Example To assign the values −1, 0, and 1 to variable A in Y = AX
2
−1, and draw a
graph for each value
3(TYPE)1(Y=)
av(A)vx-bw
J4(GRAPH)1(Y)b(av(A)
!.(=)-b)w
J4(GRAPH)1(Y)b(av(A)
!.(=)a)w
J4(GRAPH)1(Y)b(av(A)
!.(=)b)w
ffff1(SELECT)
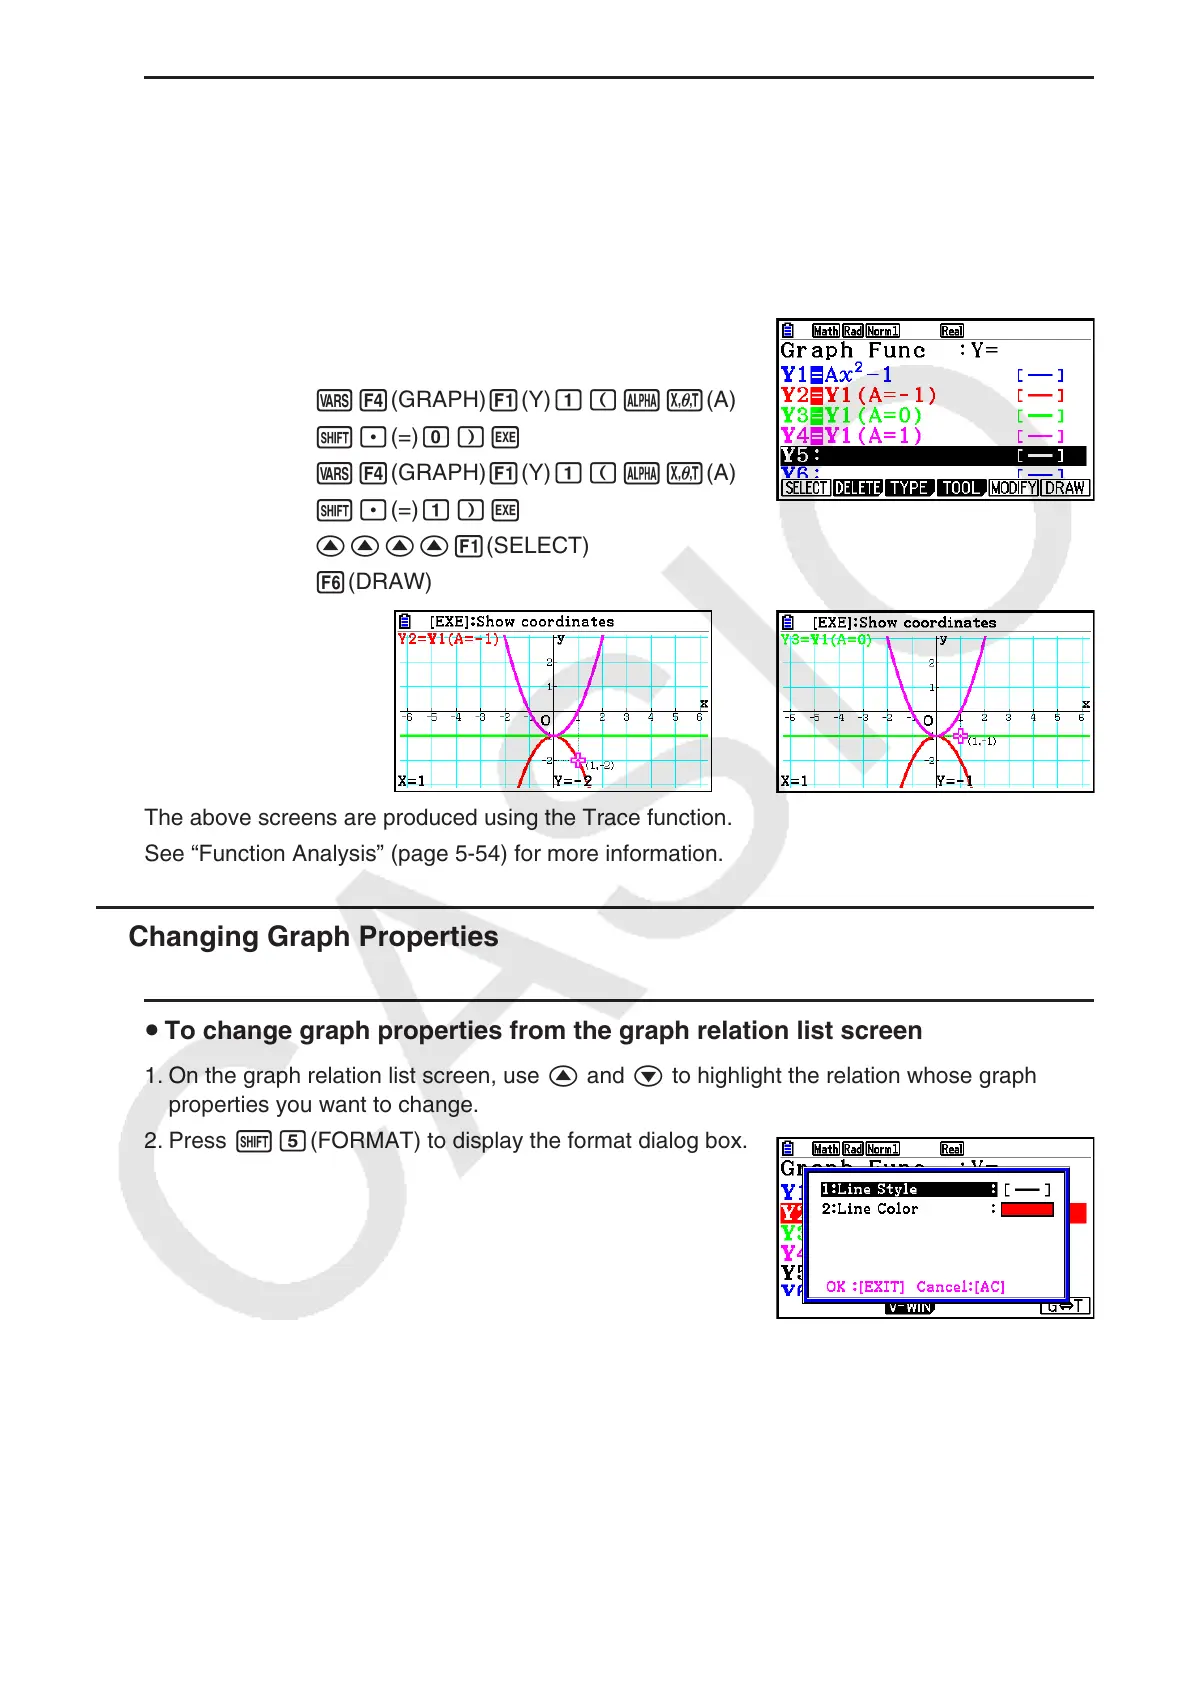
6(DRAW)
The above screens are produced using the Trace function.
See “Function Analysis” (page 5-54) for more information.
k Changing Graph Properties
u To change graph properties from the graph relation list screen
1. On the graph relation list screen, use f and c to highlight the relation whose graph
properties you want to change.
2. Press !f(FORMAT) to display the format dialog box.