EasyManuals Logo

Casio fx-CG50 User Manual

Casio fx-CG50
667 pages
To Next Page IconTo Next Page
To Previous Page IconTo Previous Page
Page #181 background imageLoading...
Page #181 background image
5-40
9 -cw
0 J
u To modify a graph in the Conic Graphs mode
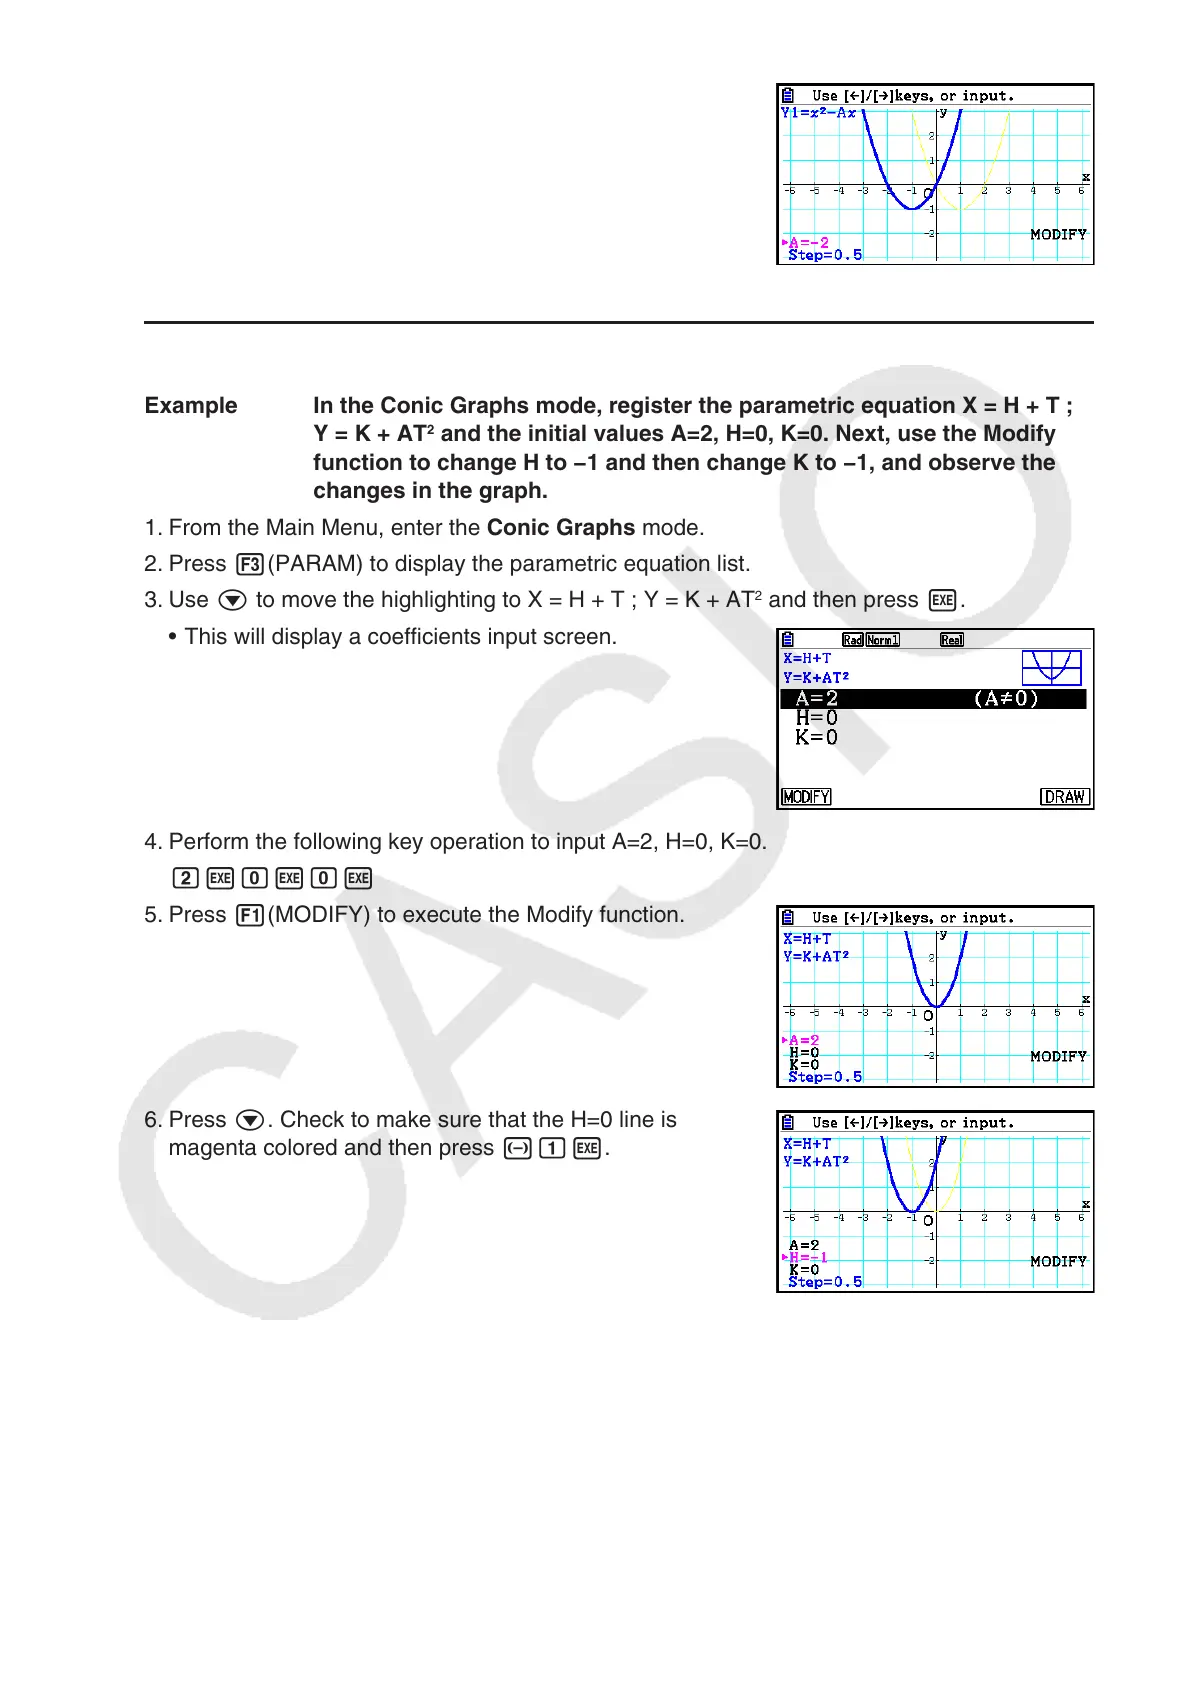
Example In the Conic Graphs mode, register the parametric equation X = H + T ;
Y = K + AT
2
and the initial values A=2, H=0, K=0. Next, use the Modify
function to change H to −1 and then change K to −1, and observe the
changes in the graph.
1. From the Main Menu, enter the Conic Graphs mode.
2. Press 3(PARAM) to display the parametric equation list.
3. Use c to move the highlighting to X = H + T ; Y = K + AT
2
and then press w.
This will display a coefficients input screen.
4. Perform the following key operation to input A=2, H=0, K=0.
cwawaw
5. Press 1(MODIFY) to execute the Modify function.
6. Press c. Check to make sure that the H=0 line is
magenta colored and then press -bw.

Table of Contents

Other manuals for Casio fx-CG50

Questions and Answers:

Question and Answer IconNeed help?

Do you have a question about the Casio fx-CG50 and is the answer not in the manual?

Casio fx-CG50 Specifications

General IconGeneral
Display TypeColor LCD
ConnectivityUSB
GraphingYes
Dimensions188.5 x 89 x 18.6 mm
Weight230 g
CASNo
Storage16 MB Flash ROM
3D GraphingYes
SpreadsheetYes
Equation SolverYes
Statistical FunctionsYes
Financial FunctionsYes
Power Source4 x AAA batteries
Programming LanguagesBASIC
Memory16 MB

Related product manuals