5-44
Example Use Dynamic Graph to graph y = A x , in which the value of coefficient
A changes from 1 through 4 in increments of 1. The Graph is drawn 10
times.
1 m Dyna Graph
2 !3(V-WIN) 1(INITIAL) J
3 !m(SET UP)cc1(On)J
4 5(BUILT-IN)1(SELECT)
5 4(VAR)bwaw
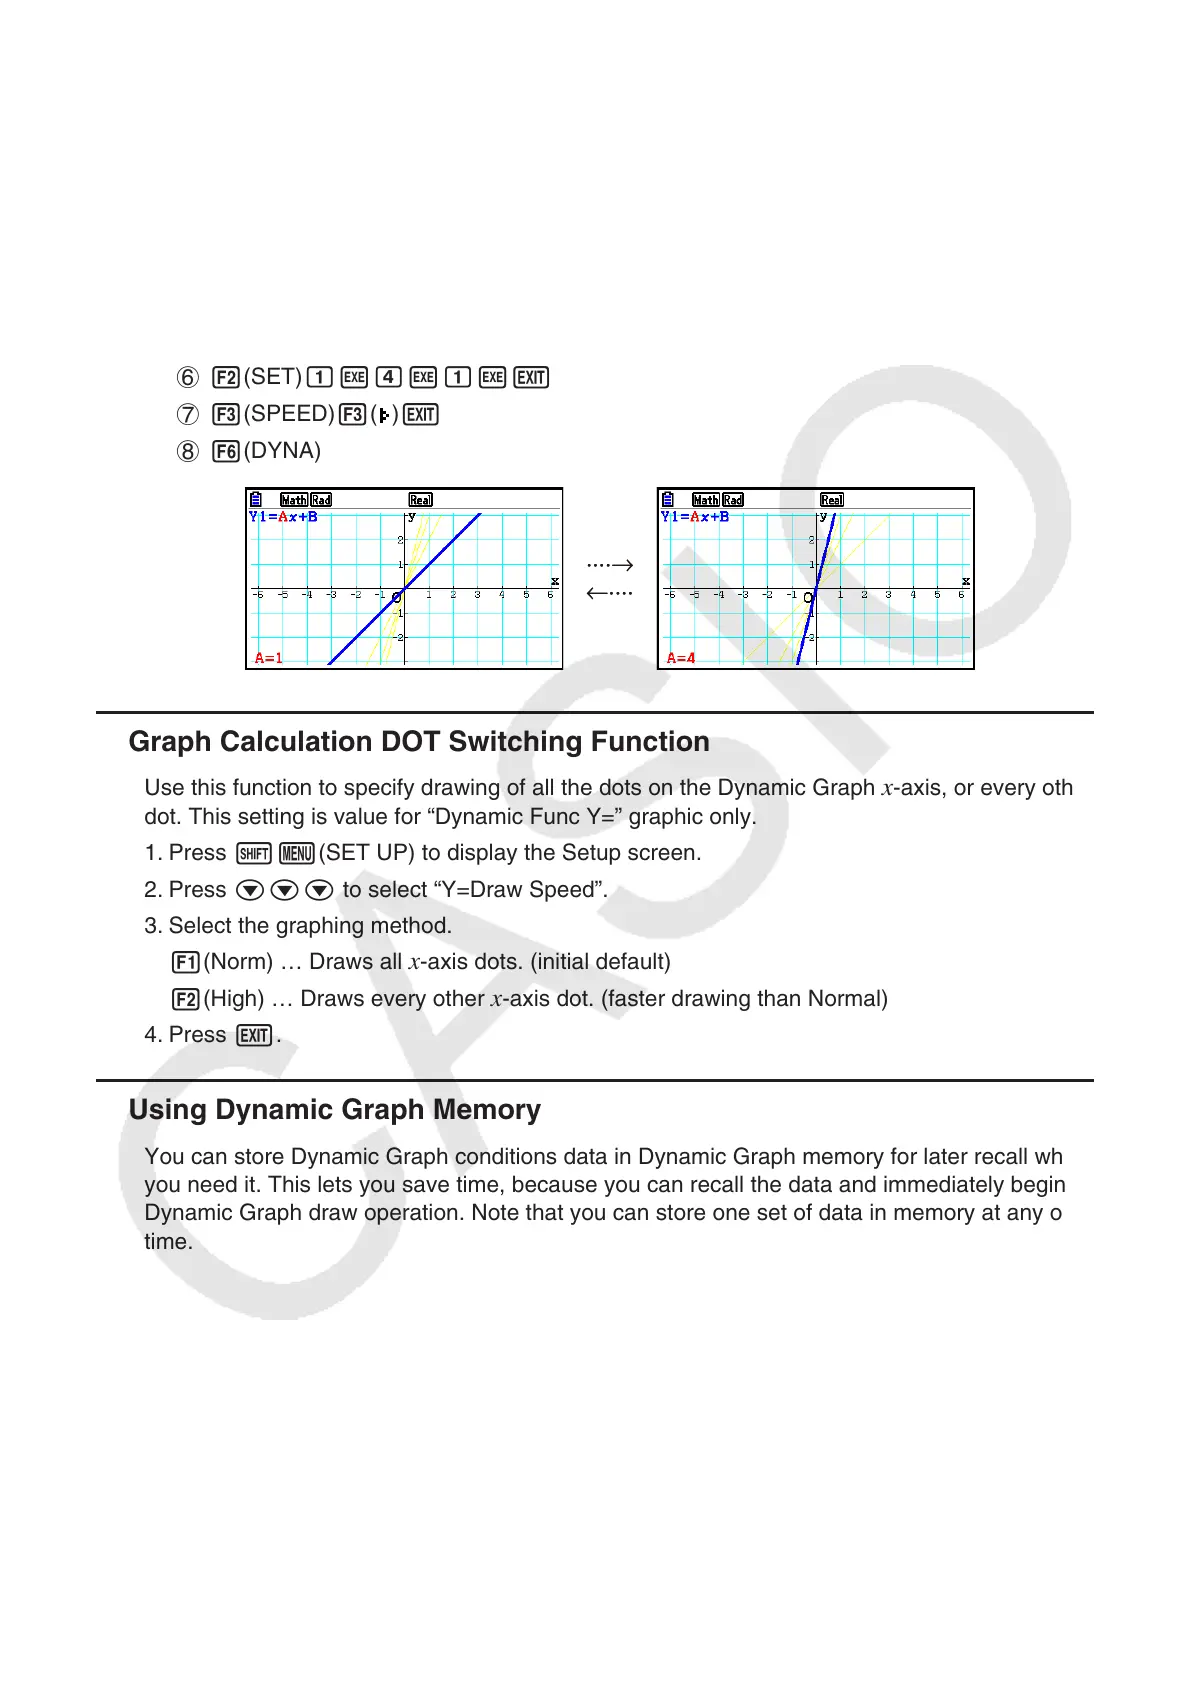
6 2(SET)bwewbwJ
7 3(SPEED)3(
)J
8 6(DYNA)
k Graph Calculation DOT Switching Function
Use this function to specify drawing of all the dots on the Dynamic Graph x-axis, or every other
dot. This setting is value for “Dynamic Func Y=” graphic only.
1. Press !m(SET UP) to display the Setup screen.
2. Press ccc to select “Y=Draw Speed”.
3. Select the graphing method.
1(Norm) … Draws all
x-axis dots. (initial default)
2(High) … Draws every other
x-axis dot. (faster drawing than Normal)
4. Press J.
k Using Dynamic Graph Memory
You can store Dynamic Graph conditions data in Dynamic Graph memory for later recall when
you need it. This lets you save time, because you can recall the data and immediately begin a
Dynamic Graph draw operation. Note that you can store one set of data in memory at any one
time.
····→
←····
····→
←····