15-15
u To configure the time (T) value
1. While the plot list screen is displayed, press 5(SET).
2. On the screen that appears, specify the start value and step value.
• If you want to specify a start value of 1 and a step of 1.5, for example, press bwb.
fw.
3. After the settings are the way you want, press w (or J).
• This returns to the plot list screen, where you can check
whether the T-value has changed as you intended.
Note
The following are the ranges for the start value and the step value.
–1.0 × 10
10
< Start < 1.0 × 10
10
0 < Step < 1.0 × 10
10
u To display plots on T-Y coordinates or T-X coordinates
1. While the plot list screen is displayed, press 1(AXTRNS). From the Picture Plot screen,
you also could press K6(g)1(AXTRNS).
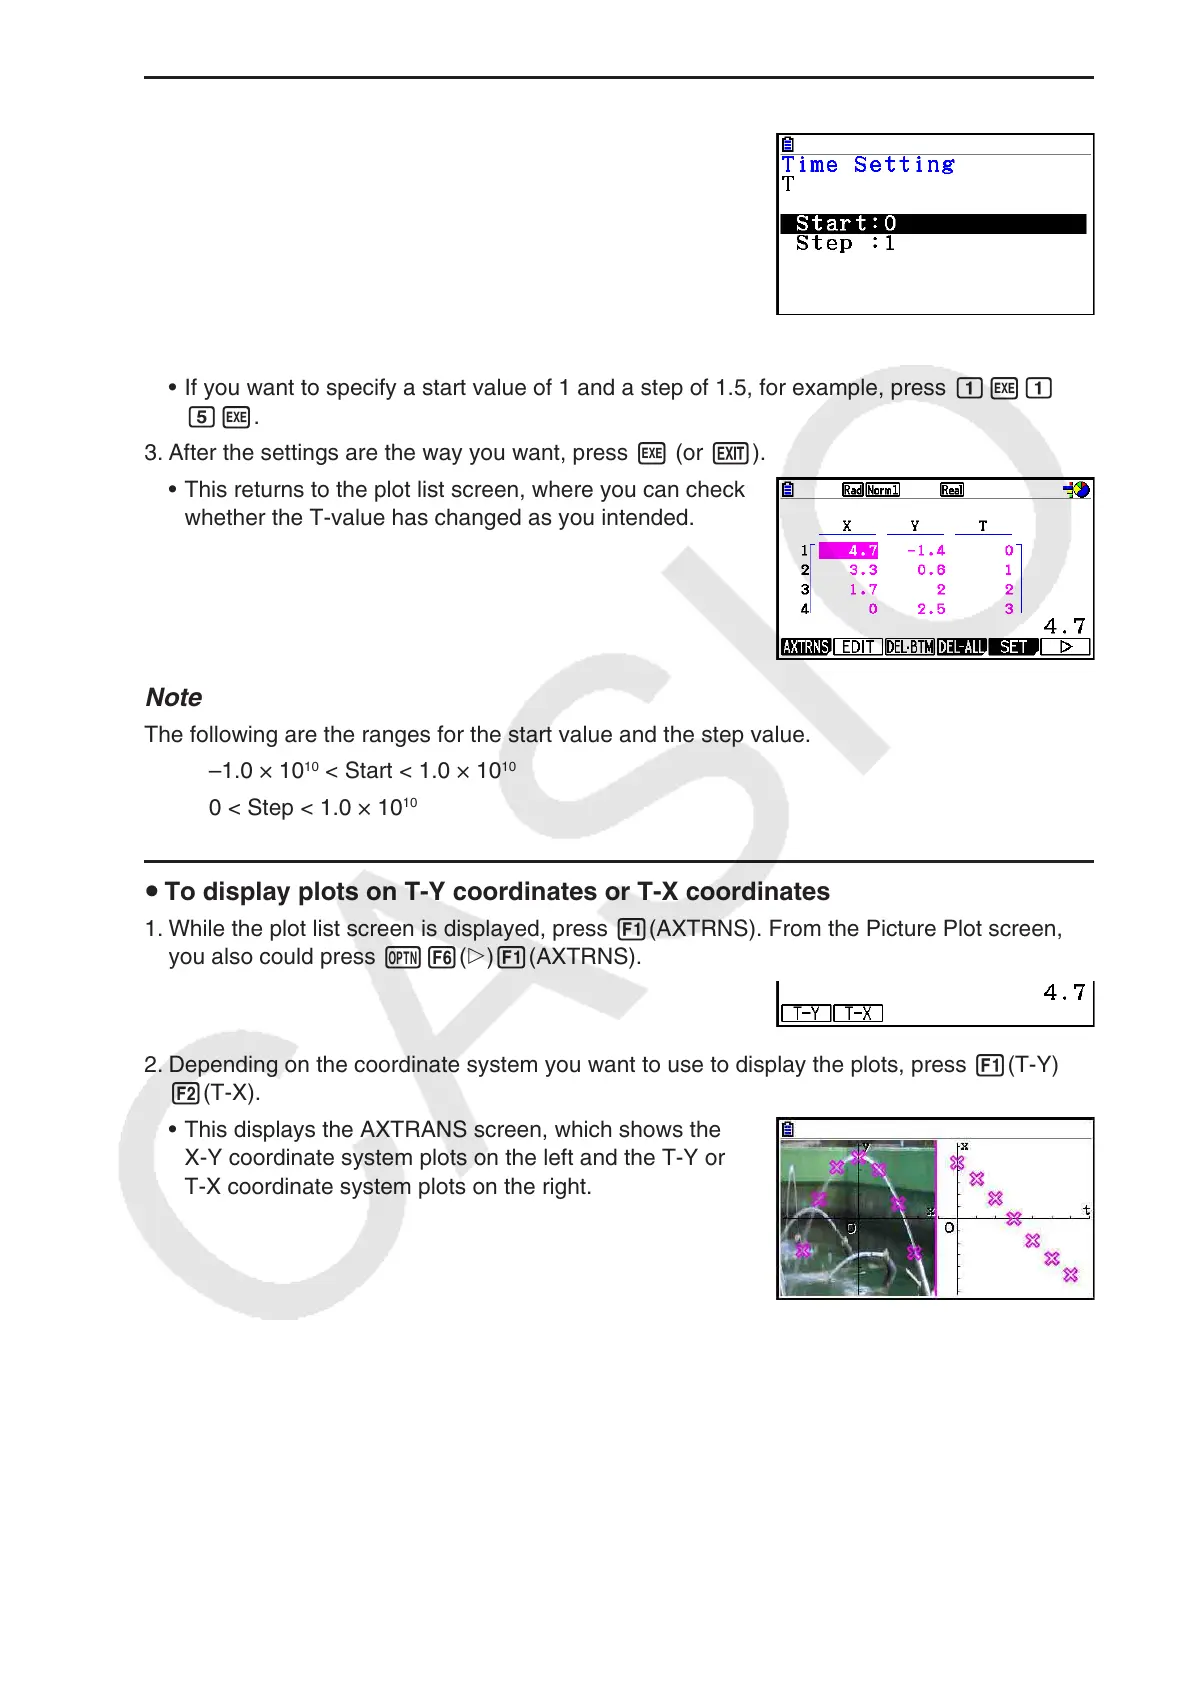
2. Depending on the coordinate system you want to use to display the plots, press 1(T-Y) or
2(T-X).
• This displays the AXTRANS screen, which shows the
X-Y coordinate system plots on the left and the T-Y or
T-X coordinate system plots on the right.