16-3
6. Press 6(DRAW) or w.
This displays the 3D graph screen and draws a sphere
graph.
•
To return to the 3D graph function list, press A. After drawing a 3D graph, each press of
!6(G⇔T) toggles between the 3D graph function list and the 3D graph screen.
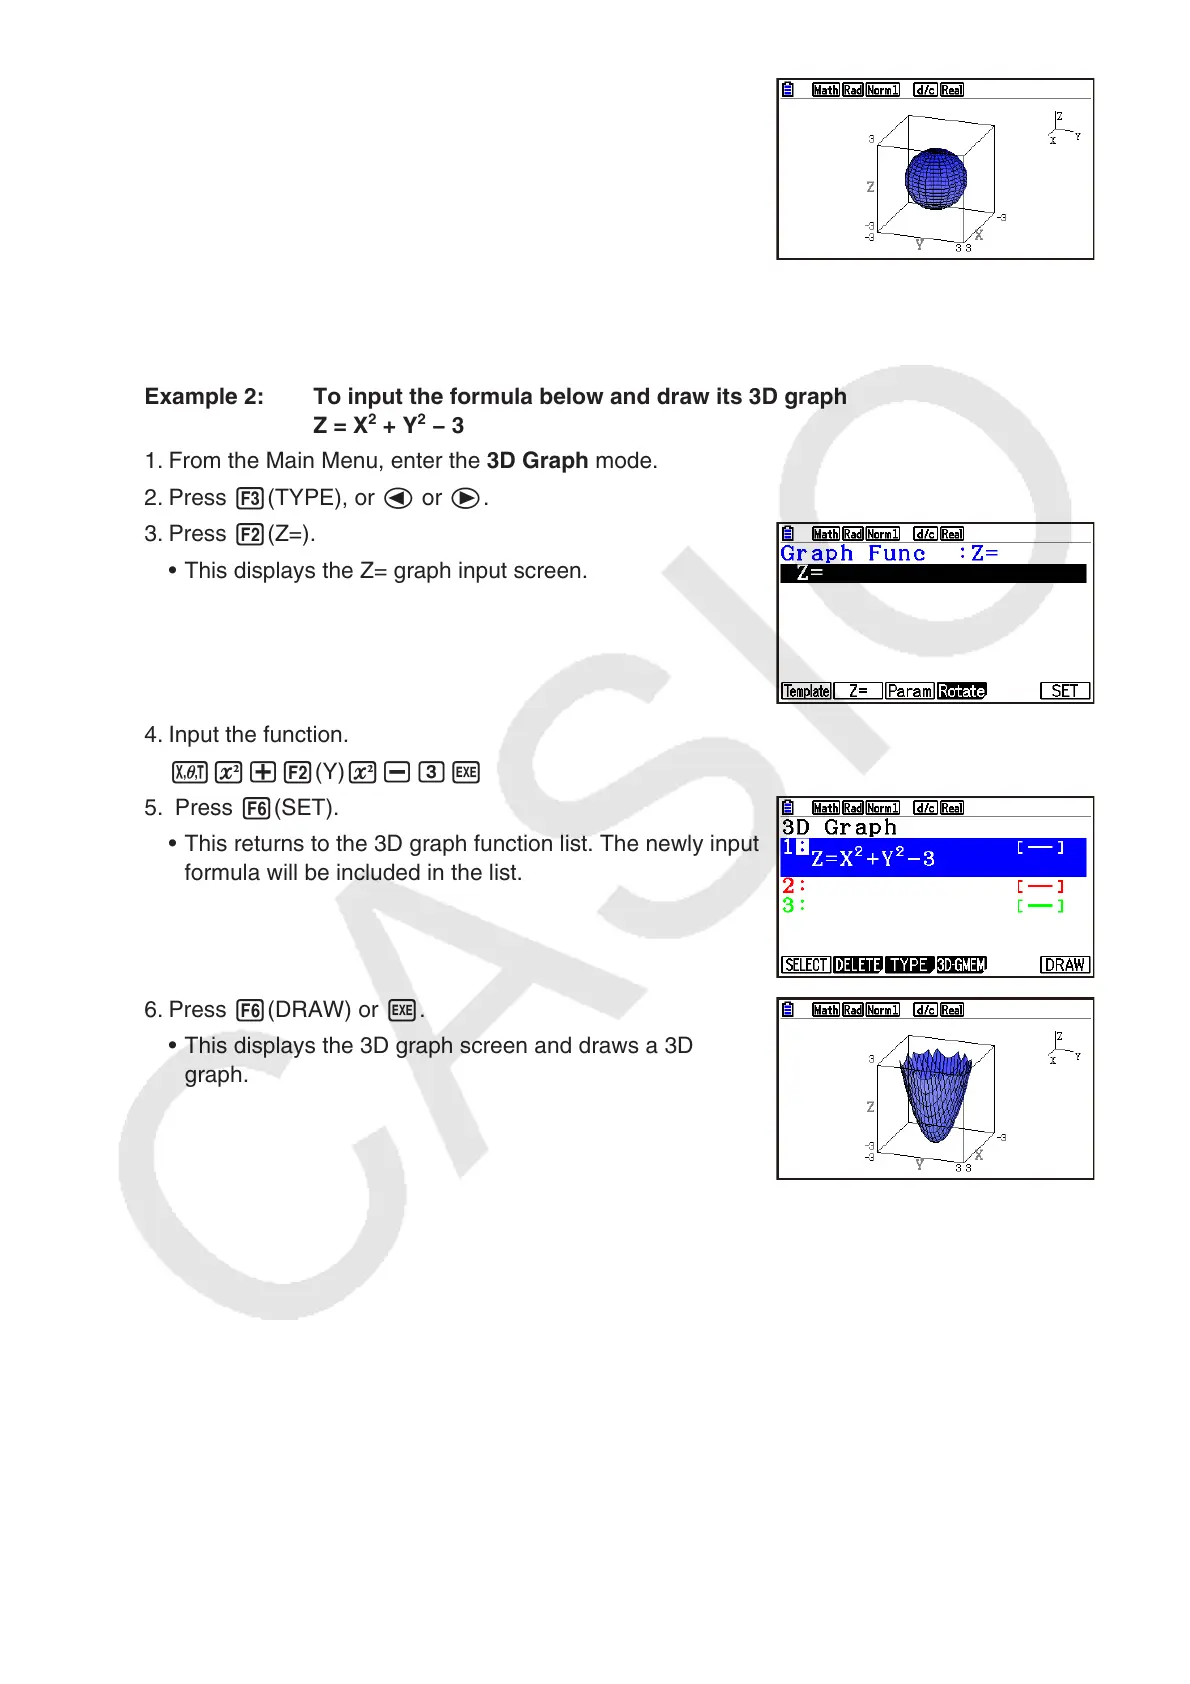
Example 2: To input the formula below and draw its 3D graph
Z = X
2
+ Y
2
− 3
1. From the Main Menu, enter the 3D Graph mode.
2. Press 3(TYPE), or d or e.
3. Press 2(Z=).
This displays the Z= graph input screen. •
4. Input the function.
vx+2(Y)x-dw
5. Press 6(SET).
This returns to the 3D graph function list. The newly input
formula will be included in the list.
•
6. Press 6(DRAW) or w.
This displays the 3D graph screen and draws a 3D
graph.
•
•