ε-48
Graph Analysis Tool Graph Screen Operations
• To move a particular graph on a multi-graph display
1. When the graph screen contains multiple graphs, press K, and then 3(EDIT).
• This displays the EDIT menu.
2. Press 2(MOVE).
• This displays only one of the graphs that were originally on the graph screen.
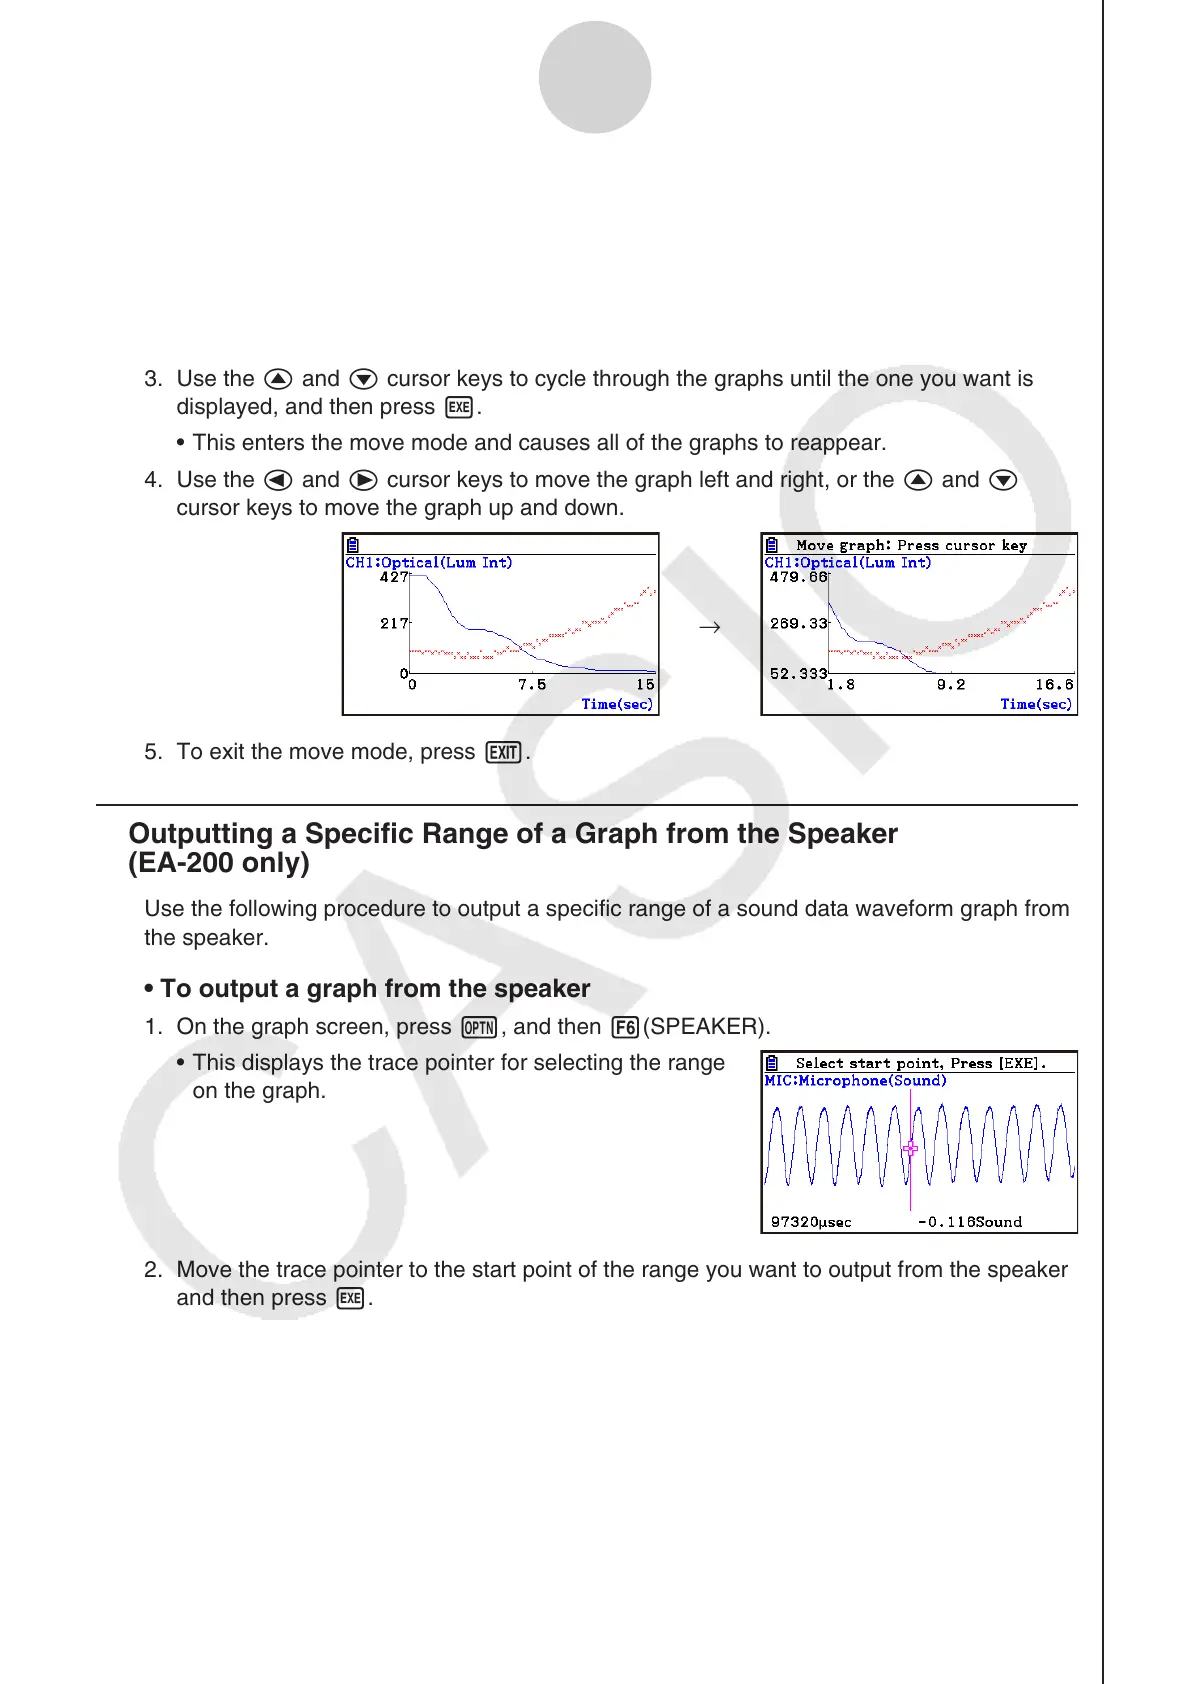
3. Use the f and c cursor keys to cycle through the graphs until the one you want is
displayed, and then press w.
• This enters the move mode and causes all of the graphs to reappear.
4. Use the d and e cursor keys to move the graph left and right, or the f and c
cursor keys to move the graph up and down.
→
5. To exit the move mode, press J.
k Outputting a Specific Range of a Graph from the Speaker
(EA-200 only)
Use the following procedure to output a specific range of a sound data waveform graph from
the speaker.
• To output a graph from the speaker
1. On the graph screen, press K, and then 6(SPEAKER).
• This displays the trace pointer for selecting the range
on the graph.
2. Move the trace pointer to the start point of the range you want to output from the speaker,
and then press w.