GRMON3-UM
June 2019, Version 3.1.0
40 www.cobham.com/gaisler
$ grmon
GRMON can optionally be started with the -gui option which will skip the dialog for selecting debug link. In this
case the GUI will start and the connection will be done according to the full command line, which must specify
a debug-link. Below is an example of starting the GUI and connecting to a LEON system using the FTDI USB
serial interface:
$ grmon -gui -ftdi
It is also possible to start the GUI from the command line interface by issuing the gui command. This is useful if
GRMON is first operated as a command line tool but the user selects to continue debugging using the graphical
represenation of the system. The on-going debug session and hardware state will not be altered but can be operated
and inspected from the GUI.
4.3. Connect to target
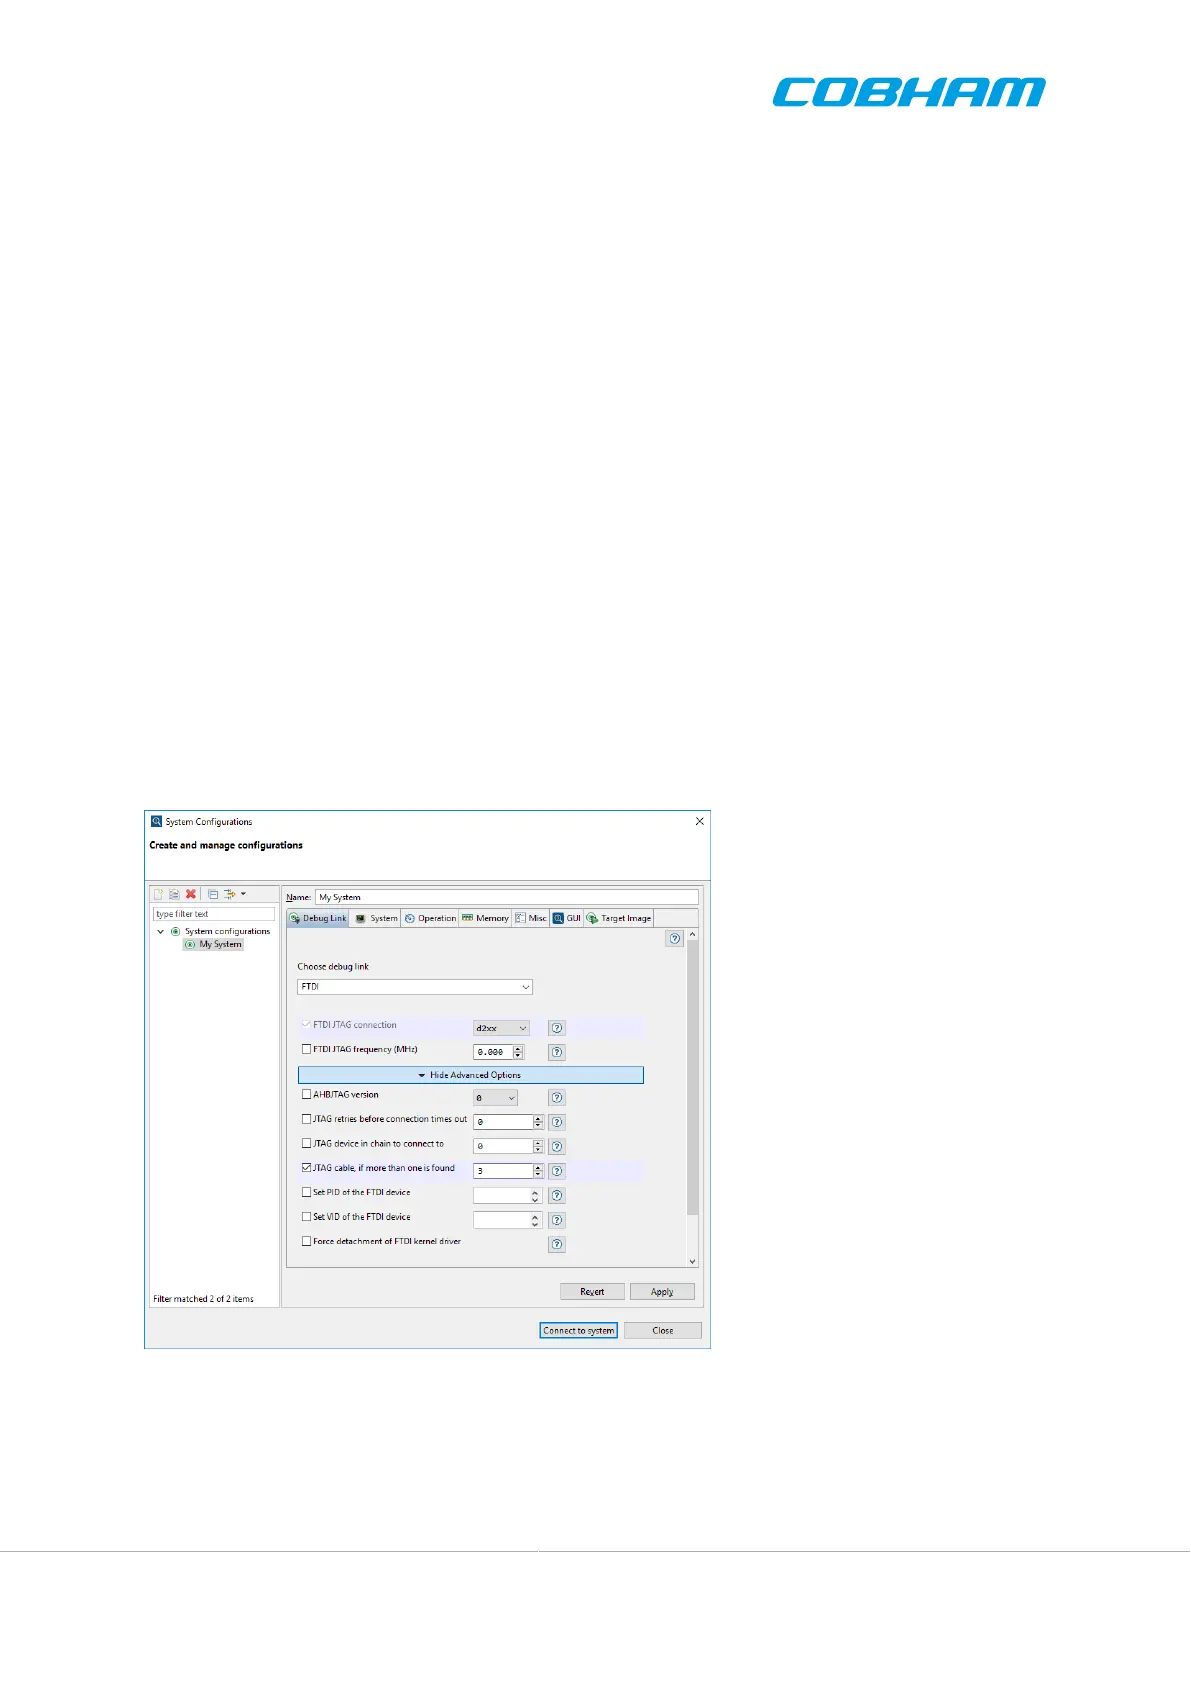
The System Configurations dialog is used to connect to the target system. It allows for selecting the debug link
and parameters which system initialization. See Figure 4.2.
The System Configurations is split into several tabs which group related settings. Here follows a brief summary
of each tab. Please browse the tabs to discover relevant settings.
• Debug Link - Choose debug link and set parameters
• System - Options related to initializations performed by GRMON when connecting to the target
• Operation - Controls how GRMON interacts with the target after connect
• Memory - Options related to memory controllers
• Misc - Driver specific options which need to be determined at connect
• GUI - Options related to how the GUI views are synchronized with the current target state
Figure 4.2. System Configurations dialog. The Debug Link tab is selected and Advanced Parameters are
displayed.
4.3.1. Debug link
The debug link to use is selected in the Choose debug link drop down menu in the Debug Link tab. as illustrated
in Figure 4.2. When a debug link has been selected, parameters specific for that debug link are displayed.