On the top right of the display it is shown the remaining
charge of the Electronic Unit. We recommend to start
using the device with a minimum of 20% charge.
Please refer to the section “HOW TO RECHARGE
THE ELECTRONIC UNIT” to recharge the device.
4) Through the “Generate report” button it is possible to
obtain a pdf le with summary data of the monitoring.
Please refer to the paragraph “MONITORING
37
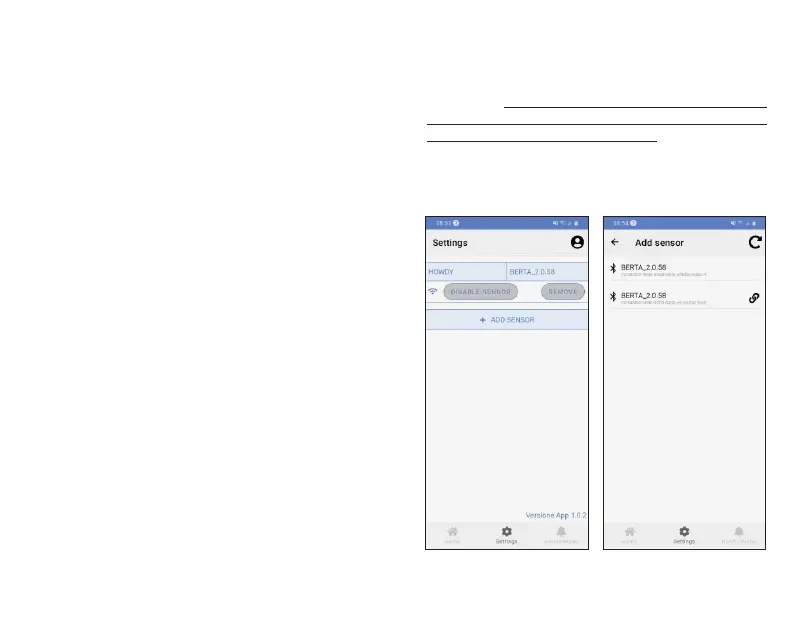
“Add Sensor” and then the Electronic Unit you wish
to use (HOWDY BABY is identied by BERTA_x.x.x).
The app will ask to match the added device with the
type of corresponding sensors (BERTA_x.x.x shall be
associated with Howdy).
As soon as an external device (smartphone/tablet)
connects to the Electronic Unit, the blue LED light will
turn o and the “Sensor connected” notication will be
dispayed on your smartphone/tablet.
On the start screen you can now view the following
parameters: heart rate, breathing rate, posture .
WARNING: the ECG tracing viewed through the APP
has only qualitative value and it should not be intended
and/or used for diagnostic purposes.
6) You can leave the APP at any time, following the
instructions in the paragraph “HOW TO LEAVE THE
APP”.
The Howdy App allows communication with two
additional sensors that detect temperature and blood
saturation:
-Thermometer:Tempsitter Wireless Thermometer;
European Authorized Representative : Shangai
International Holding Corp. GmbH(Europe)
-Wireless pulse oximeter : OXY-10 Pulse oximeter;
Manufacturer: GIMA
Follow the procedure described above to connect the
two sensors to the app.
The thermometer will be displayed as: BLT_MODT
The pulse oximeter will be displayed as: PC_60NW
These sensors can communicate with the app if the
Howdy device is already connected.
Figura 8.
Settings
Adding and managing sensors.
SESSION” for more information.
5) Through the “Real-time ECG” button or clicking the
parameters “Heart rate” and “Breath rate” button it is
possible to view the graphs.