Section 3: Onsite Analysis - Measurement Menu
55
Analyzing Measurements
The spectrum/waveform/tachometer reading is displayed on the
instrument screen once a measurement has been taken. Spectra
and waveforms displayed on the instrument can be analyzed in the
following ways:
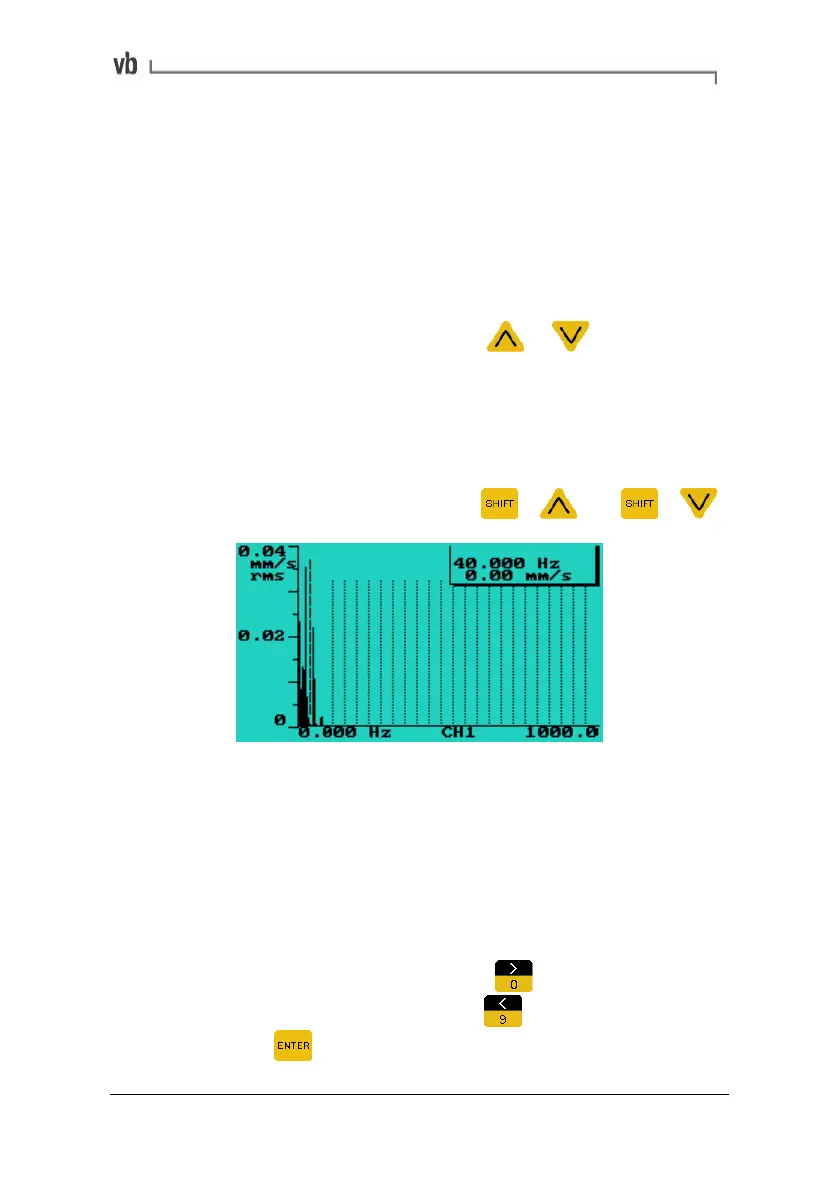
Displaying the amplitude/frequency of a peak
• To read the vibration amplitude or level corresponding to a
particular frequency or time press
or to move the
cursor to that frequency or time value. The values indicated
by the cursor are displayed at the top-right of the screen.
Note: The overall vibration value is not displayed while cursors are
activated.
• To move the cursor rapidly press
+ and +
Using cursors to display frequency and amplitude levels
Displaying harmonics
• To identify the harmonics of a peak, move the cursor to the
peak of interest. If the harmonic cursors option has been
turned on (see below), additional cursors are displayed at
frequency or time values that are whole-number multiples of
the frequency or time value indicated by the main cursor.
• To turn on harmonic cursors press
to access the
Display Options Menu then press
to toggle the cursors
on. Press
to return to the chart display.
Artisan Technology Group - Quality Instrumentation ... Guaranteed | (888) 88-SOURCE | www.artisantg.com