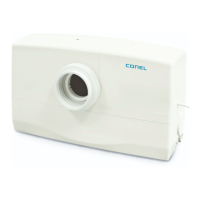
16.
Curva de rendimiento
Figura 12
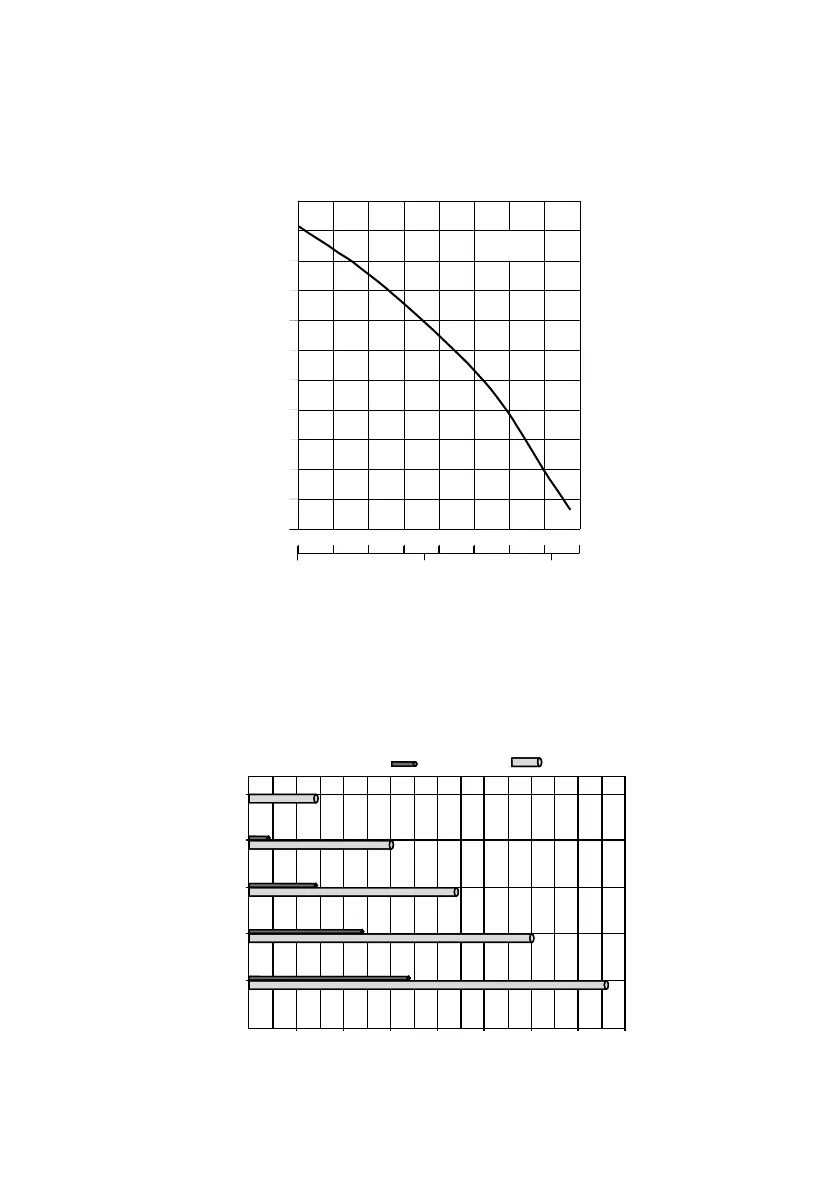
17.
Líneas de descarga
Figura 13
Longitudmáximadetuberíapermisibleparaelfuncionamientoópmodelaunidad.
Sehanconsideradodoscodosde90°yunaválvulaanrretornoABS.
1
0
0
1
2
3
4
5
6
7
8
9
1
2 3 4 5
2
6 87
H
(m)
Q
(m
3
/h)
(l/s)
50 Hz
10
12
5
4
3
2
1
5
V
(m)
H
(m)
10 15 20 25 30 35 40
O.D.
Ø 25 mm
O.D.
Ø 32 mm
V = Vertical discharge line length; H = Horizontal discharge line length
H = Total head; Q = Discharge volume Curves to ISO 9906
1
0
0
1
2
3
4
5
6
7
8
9
1
2 3 4 5
2
6 87
H
(m)
Q
(m
3
/h)
(l/s)
50 Hz
10
12
5
4
3
2
1
5
V
(m)
H
(m)
10 15 20 25 30 35 40
O.D.
Ø 25 mm
O.D.
Ø 32 mm
V = Vertical discharge line length; H = Horizontal discharge line length
H = Total head; Q = Discharge volume Curves to ISO 9906
H=Alturadeelevación;Q=Volumendedescarga,curvassegúnISO9906
V=Longituddelatuberíadedescargavercal;H=Longituddelatuberíadedescargahorizontal
165
 Loading...