Appendix C. Log Displays
EY.65.H4.02
87
APPENDIX C. LOG DISPLAYS
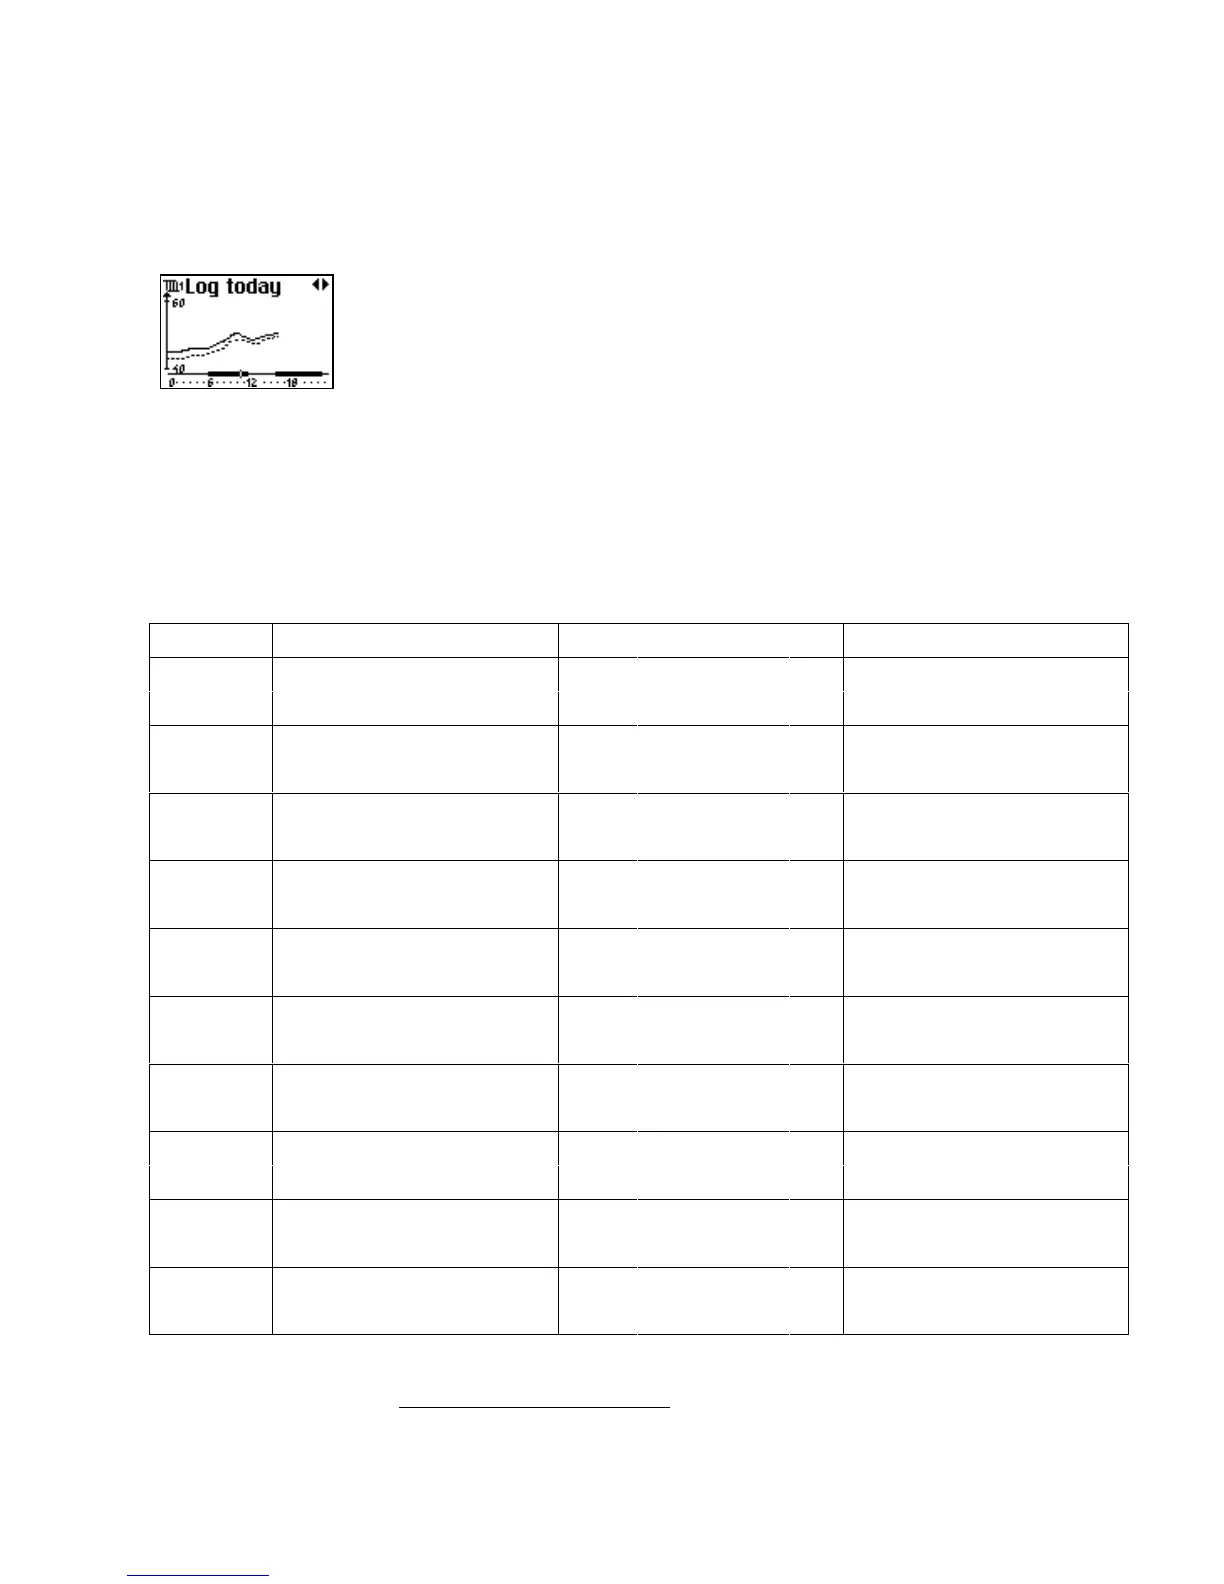
The display picture to the left is an example of an ECL 2000 Log picture. You can
display today’s and yesterday’s log from the circuit picture (see page 12) and from
Manual Override (page 36).
Depending on the currently selected application, the log data displayed in these pic-
tures is slightly different. The table below tells you what data is displayed in today’s
and yesterday’s logs for the individual circuits of each ECL 2000 application. For
example, the table entry
______
Flow temp.
S1
indicates that the fully drawn curve in the log picture shows the flow temperature
measured by the sensor S1. See the ECL 2000 Installation Guide (Ref. [2]) for dia-
grams showing the location of the sensors for each application.
Application Heat circuit 1 Heat circuit 2 Hot-water circuit
1
______
Flow temp. S1
______
Flow temp. S4
--------- Return temp. S2 --------- Return temp. S5
2
______
Flow temp. S1
______
Upper tank temp. S6
--------- Return temp. S2 --------- Lower tank temp. S7
3
______
Flow temp. S1
______
Upper tank temp. S6
--------- Return temp. S2 --------- Lower tank temp. S7
4
______
Flow temp. S4
______
Upper tank temp. S6
--------- Return temp. S5 --------- Lower tank temp. S7
5
______
Flow temp. S1
______
Upper tank temp. S6
--------- Return temp. S2 --------- Lower tank temp. S7
6
______
Flow temp. S1
______
Upper tank temp. S6
--------- Return temp. S2 --------- Lower tank temp. S7
7
______
Flow temp. S4
______
Upper tank temp. S6
--------- Return temp.
1
S11 --------- Lower tank temp. S7
8
______
Flow temp. S1
______
Upper tank temp. S6
--------- Return temp. S2 --------- Lower tank temp. S7
9
______
Flow temp. S1
______
Flow temp. S4
--------- Return temp. S2 --------- Return temp. S5
10
______
Flow temp. S1
______
Flow temp. S4
______
Upper tank temp. S6
--------- Return temp. S2 --------- Return temp. S5 --------- Lower tank temp. S7
1
ECL 2000 Type 2 only