2.7.3 Example of Energy Savings
As can be seen from the figure (the laws of proportionality), the flow is controlled by changing the RPM. By reducing the speed only 20% from the rated
speed, the flow is also reduced by 20%. This is because the flow is directly proportional to the RPM. The consumption of electricity, however, is reduced
by 50%.
If the system in question only needs to be able to supply a flow that corresponds to 100% a few days in a year, while the average is below 80% of the
rated flow for the remainder of the year, the amount of energy saved is even more than 50%.
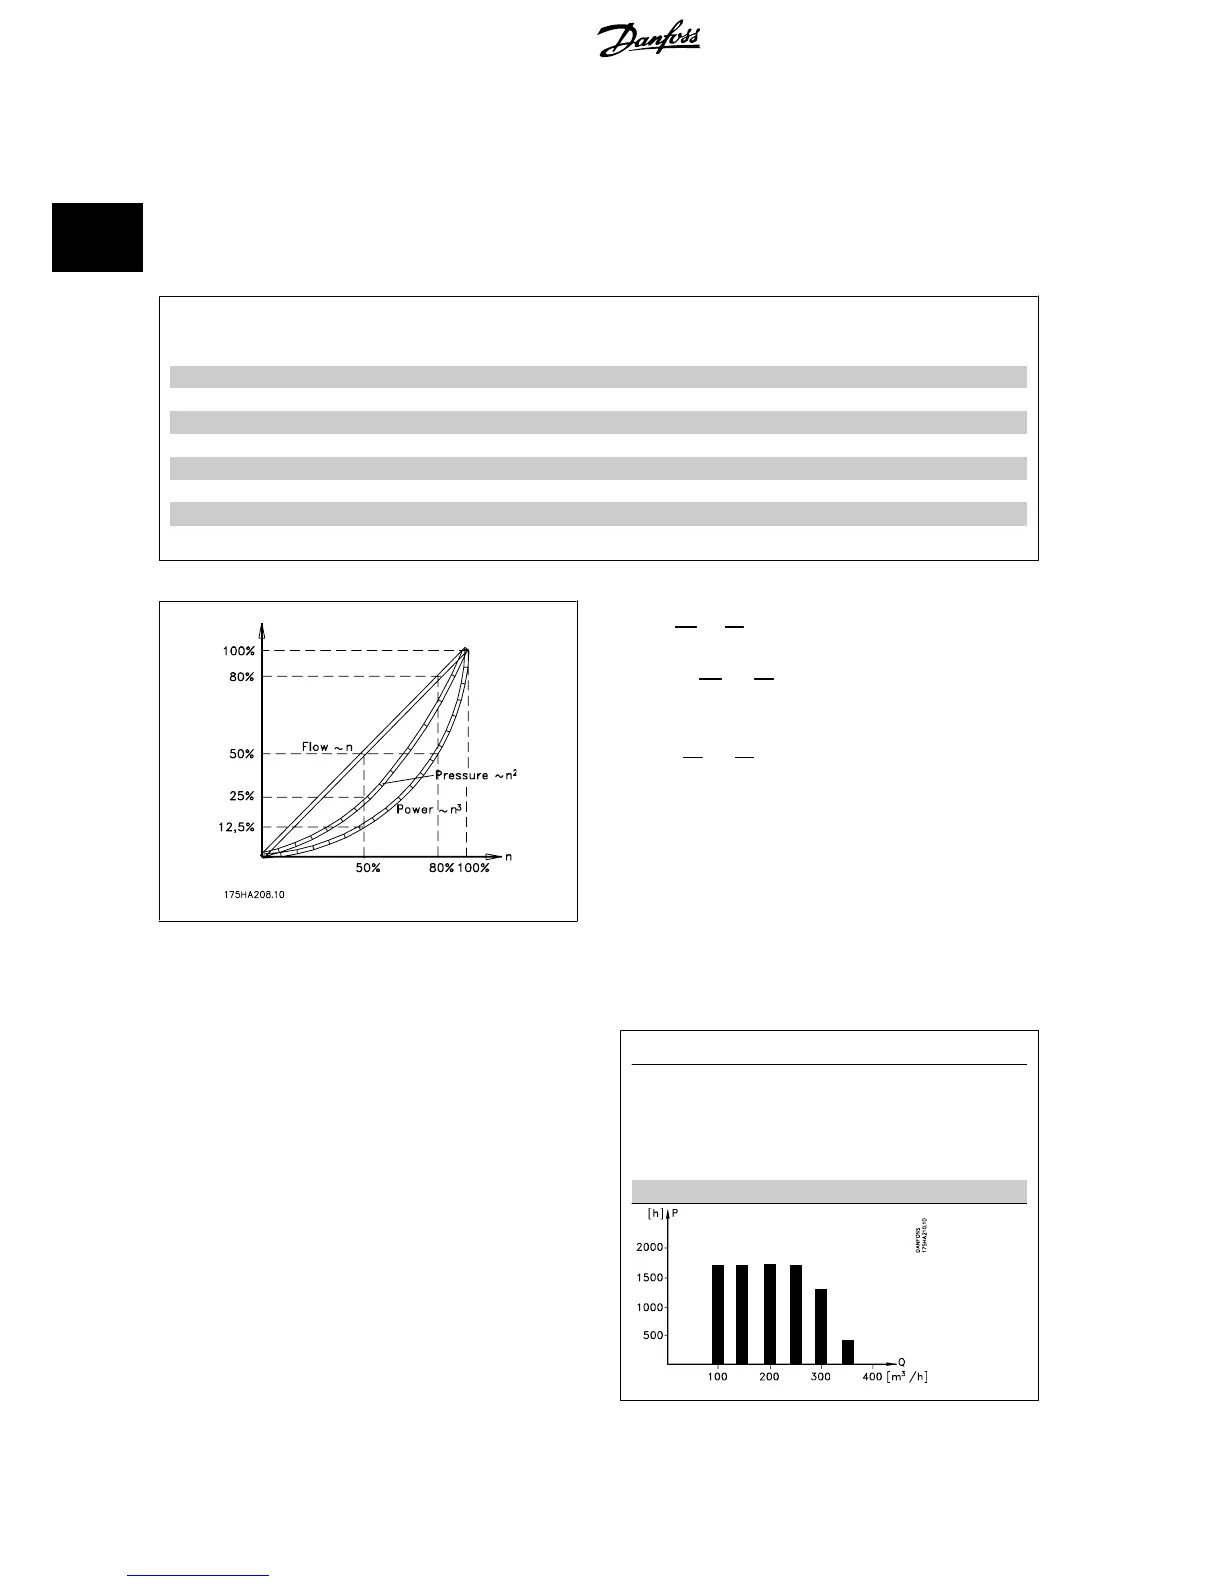
The laws of proportionality
The figure below describes the dependence of flow, pressure and power consumption on RPM.
Q = Flow P = Power
Q
1
= Rated flow P
1
= Rated power
Q
2
= Reduced flow P
2
= Reduced power
H = Pressure n = Speed regulation
H
1
= Rated pressure n
1
= Rated speed
H
2
= Reduced pressure n
2
= Reduced speed
Flow
:
Q
1
Q
2
=
n
1
n
2
Pressure
:
H
1
H
2
=
(
n
1
n
2
)
2
Power
:
P
1
P
2
=
(
n
1
n
2
)
3
2.7.4 Example with Varying Flow over 1 Year
The example below is calculated on the basis of pump characteristics ob-
tained from a pump datasheet.
The result obtained shows energy savings in excess of 50% at the given
flow distribution over a year. The pay back period depends on the price
per kwh and price of frequency converter. In this example it is less than
a year when compared with valves and constant speed.
Energy savings
P
shaft
=P
shaft output
Flow distribution over 1 year
2 Introduction to VLT AQUA Drive VLT
®
AQUA Drive Design Guide
16
MG.20.N5.02 - VLT
®
is a registered Danfoss trademark
2
 Loading...