17
English
16
6.1 Getting Started
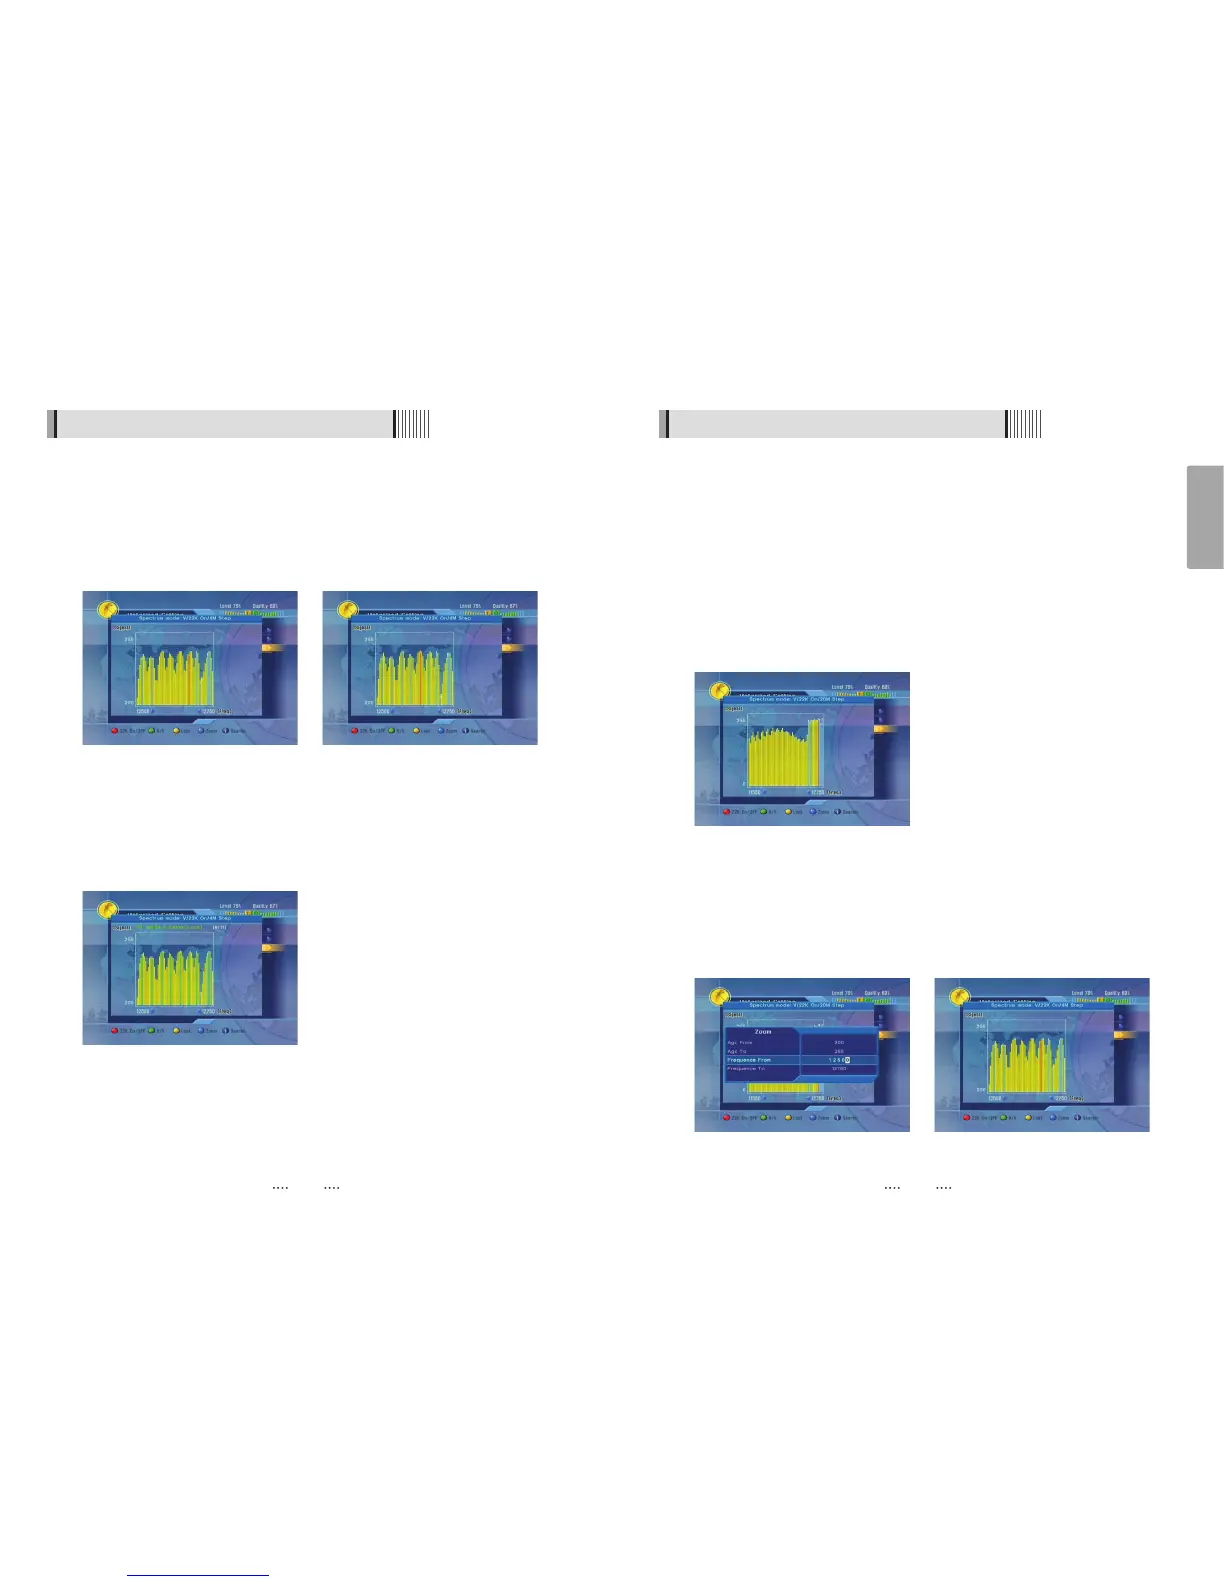
The bars height indicates the LNB input mode of the receiver. High values (close to 255)
show that input signal is suppressed by the attenuator at high degree and input signal
overload can occur. Low values (close to 0) show the maximum boost of the input signal.
Noise level may highly interfere with the input signal in this case. The best quality signal is
normally displayed in the upper part of the graph and does not exceed the limits.
Adding new transponders
Zoom function is used for detailed display of the histogram. It allows locate transponders
which are not in the preset list, set the expected frequency range and then add those
transponders by “Blind Scan” to the list. Moreover, many well known satellites can be
recognized by their spectrum shape.
Fine tuning of the dish position
Zoom function allows the fine tuning of the dish position. To set the dish position very
precisely the part of the spectrum can be zoomed in. For example, you can display
spectrum only within level 50~255 if LNB cable is short and the spectrum is located in the
upper part of the graph. On the contrary, if the signal is low you can set upper limit to 150 or
100 to see more detailed picture of the spectrum.
6.1 Getting Started
SPECTRUM ANALYSER
General information
The spectrum is displayed as histogram. YELLOW bars indicate signal presence. BLUE bars
indicate signal presence and transponder presence of the selected satellite. RED bars
indicate the frequency of the selected transponder. GREEN bars indicate the locked
frequencies.
Press “LOCK” YELLOW button to verify all the transponders indicated by all the BLUE bars
visible in the active window: whether the transponders are locked or not. The transponder
which is under checking is displayed above the histogram. Here you can see ratio: locked
transponders / all transponders. Press YELLOW button again to cancel verify mode. This
function mainly used for testing transponders’ signal
In spectrum analyzer mode you can switch LNB mode quickly. Press GREEN button to
change polarization, press RED button to switch between high and low frequency ranges.
Selected LNB mode is displayed above the histogram. Frequency bar width (in MHz) is
displayed above the histogram too. Minimum and maximum frequency limits are shown at
the horizontal axis of the graph.
<Three new transponders (no blue bars under the
three “bells”) can be added by “blind scan” to preset
list (12 500 ~ 12 700 MHz, vertical polarization)>
<New transponders found and added to preset list>
<Zoom function (setting level and frequency limits)> <Spectrum part after Zoom applied>
<Transponders under testing for locked signal>
<Full spectrum>