User Guide
Product: Evolis
A_Evolis Solution GB elancity
Page
/
Date: 03/01/2018
Confidential document, property of ELANCITY. All copies and transfers are unauthorized without prior consent.
7 DATA ANALYSIS:
Evograph software: The Evograph software analyzes and processes the data collected
by the radar sign. The software is simultaneously installed with Evocom (see section 6 of
this manual, above).
In just a few clicks, the Evograph can generate reports and charts (PDF or Excel) using the
data collected.
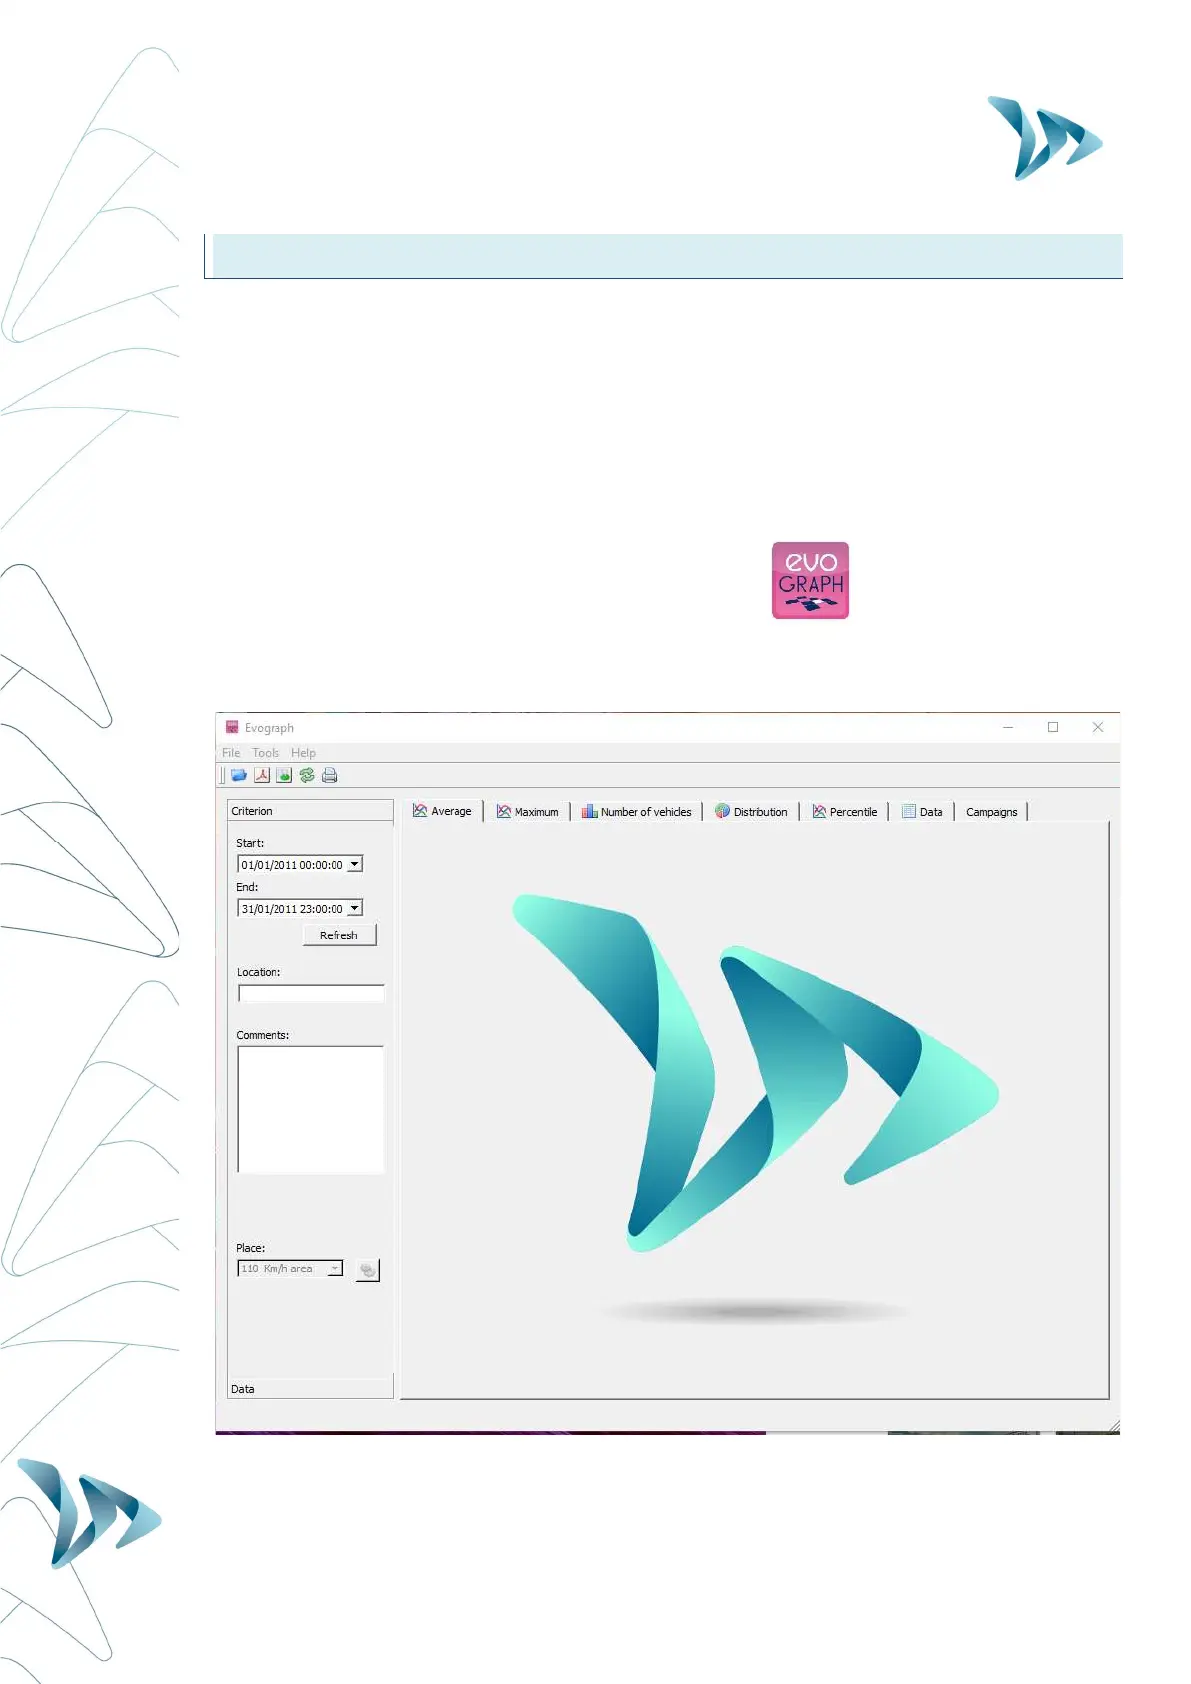
7.1 GRAPHIC VISUALIZATION:
To open the EvoGraph software click on the symbol:
Step 1. Evograph Home page:
Step 2. Selection and loading of the file you wish to view process: