User Guide
Product: Evolis
A_Evolis Solution GB elancity
Page
/
Date: 03/01/2018
Confidential document, property of ELANCITY. All copies and transfers are unauthorized without prior consent.
7.4 OTHER EVOGRAPH FEATURES
Printing to PDF file:
This icon allows you to export the graphs to a PDF format for storage or printing. You’ll be
asked if you want to print all the graphs or simply the one that is displayed on the screen.
If you complete the fields "Location" and "Comments" then this information will appear as a
footer (PDF or paper).
Export to Excel:
This icon allows you to export your data to an Excel document for example to make
personalized graphs or to compile data over specific recording periods.
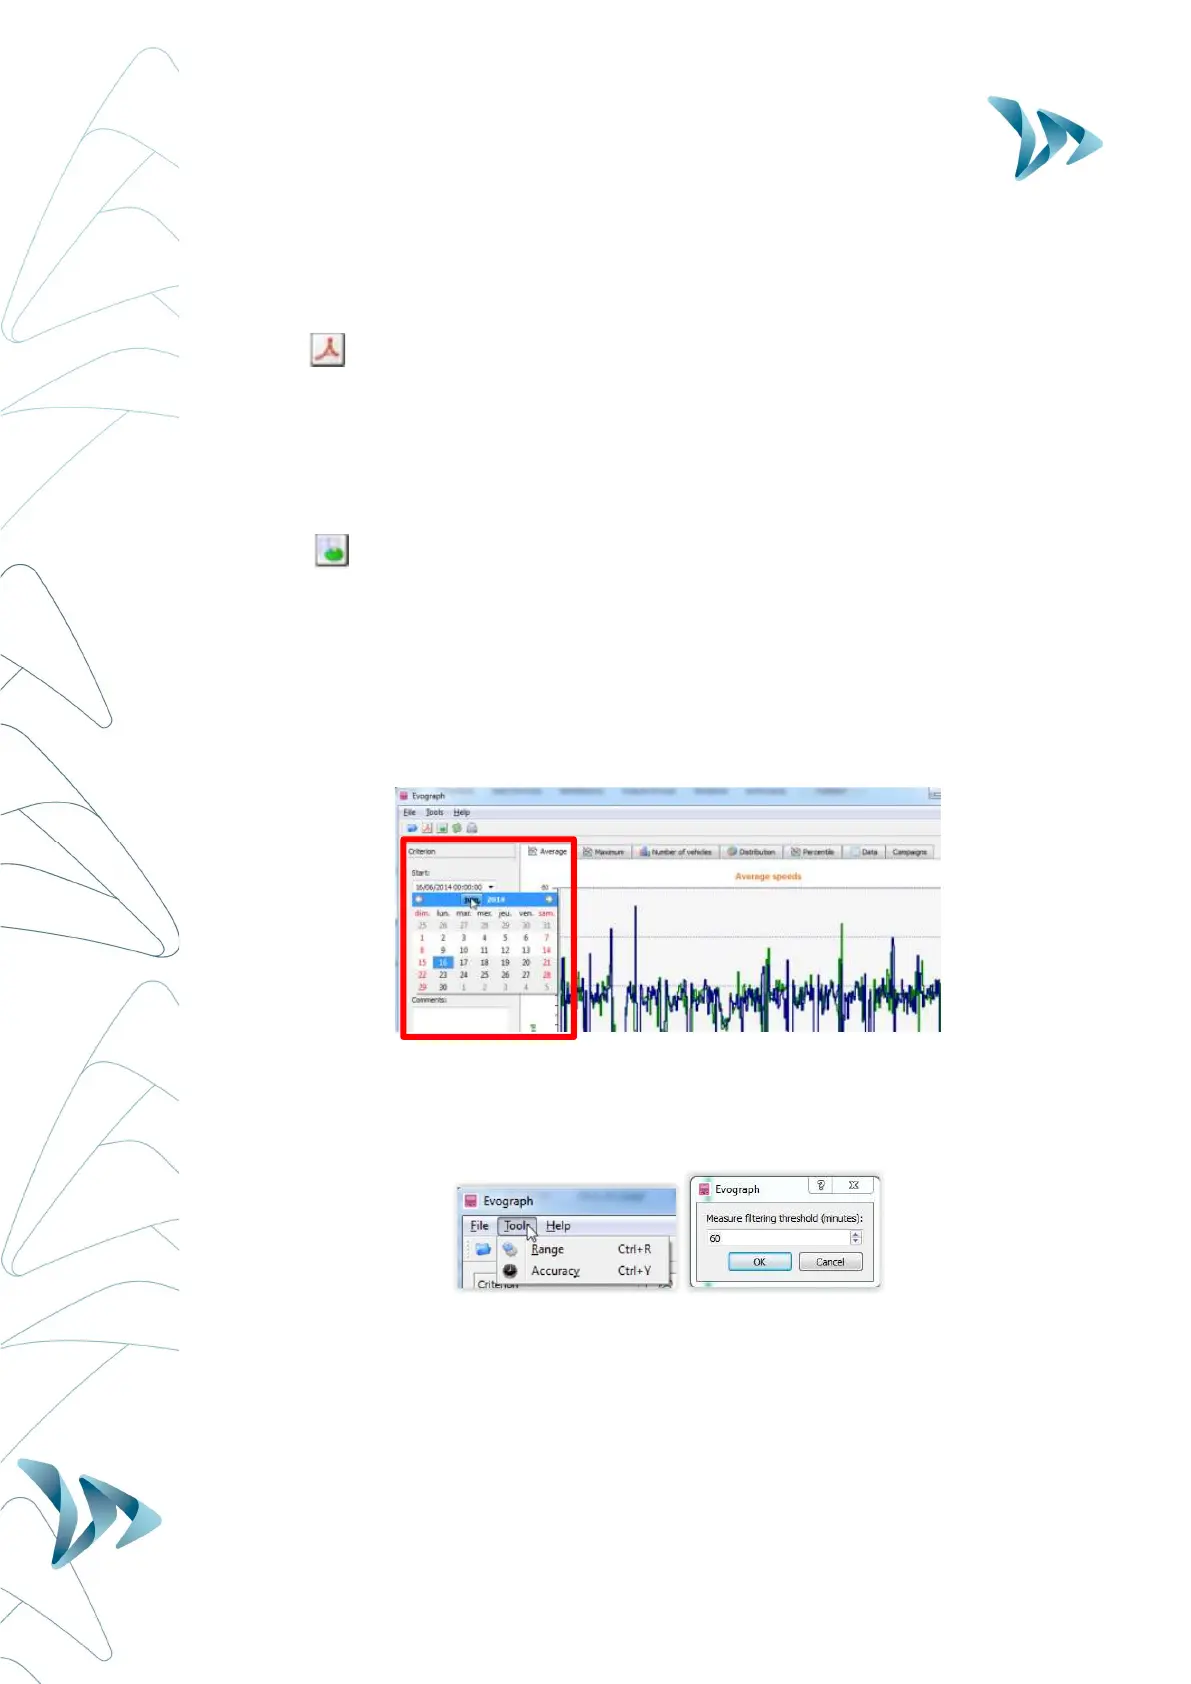
Dates selection:
The graphs initially focus on the entire recording period.
In order to generate specific statistics on a given period, select the function “selection by
calendar.”
You can also "zoom" on the graph and this allows you also to view & analyze the statistics on
specific and if required, short, periods of time.
Timescale graphs):
You can select a scale of half an hour or an hour.
Change the information of a campaign:
The title and the details can be changed under the tab "Campaigns" as well as the
starting/ending dates of the campaign.