R
21
6.3 STATISTICS VALUES
The statistics calculated by your gauge are given in Table 1.
7 LIMITS
For each parameter that your gauge measures, you can set a low limit and a high limit. Each of these limits
can be toggled on/off.
When the value of a parameter exceeds a limit which is toggled ‘on’ the gauge alerts the user:
• an audible alarm sounds
• a red light flashes
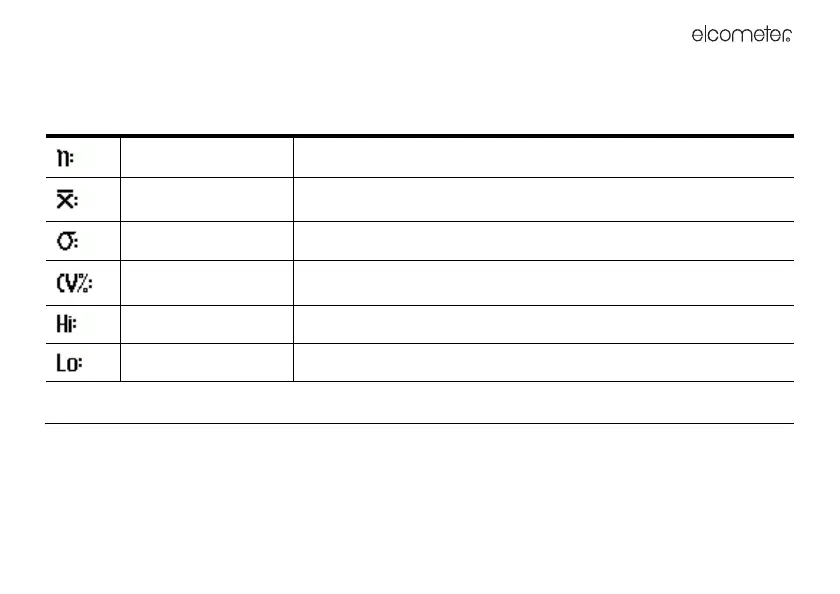
Table 1: Calculated statistics values
Number of Readings The current number of sets of reading data saved in a batch.
Mean
The average of a group of readings; the sum of the individual
readings divided by the number of readings.
Standard Deviation A statistical measure of the spread of values in a group of readings.
Coefficient of Variation
The standard deviation divided by the mean for a group of readings,
expressed as a percentage.
Highest Value The highest reading value.
Lowest Value The lowest reading value.