COMPONENT MAINTENANCE MANUAL
BA27
24-01-01
This document contains Data controlled by the U.S. Export Administration Regulations. Diversion or use contrary to U.S. law is prohibited
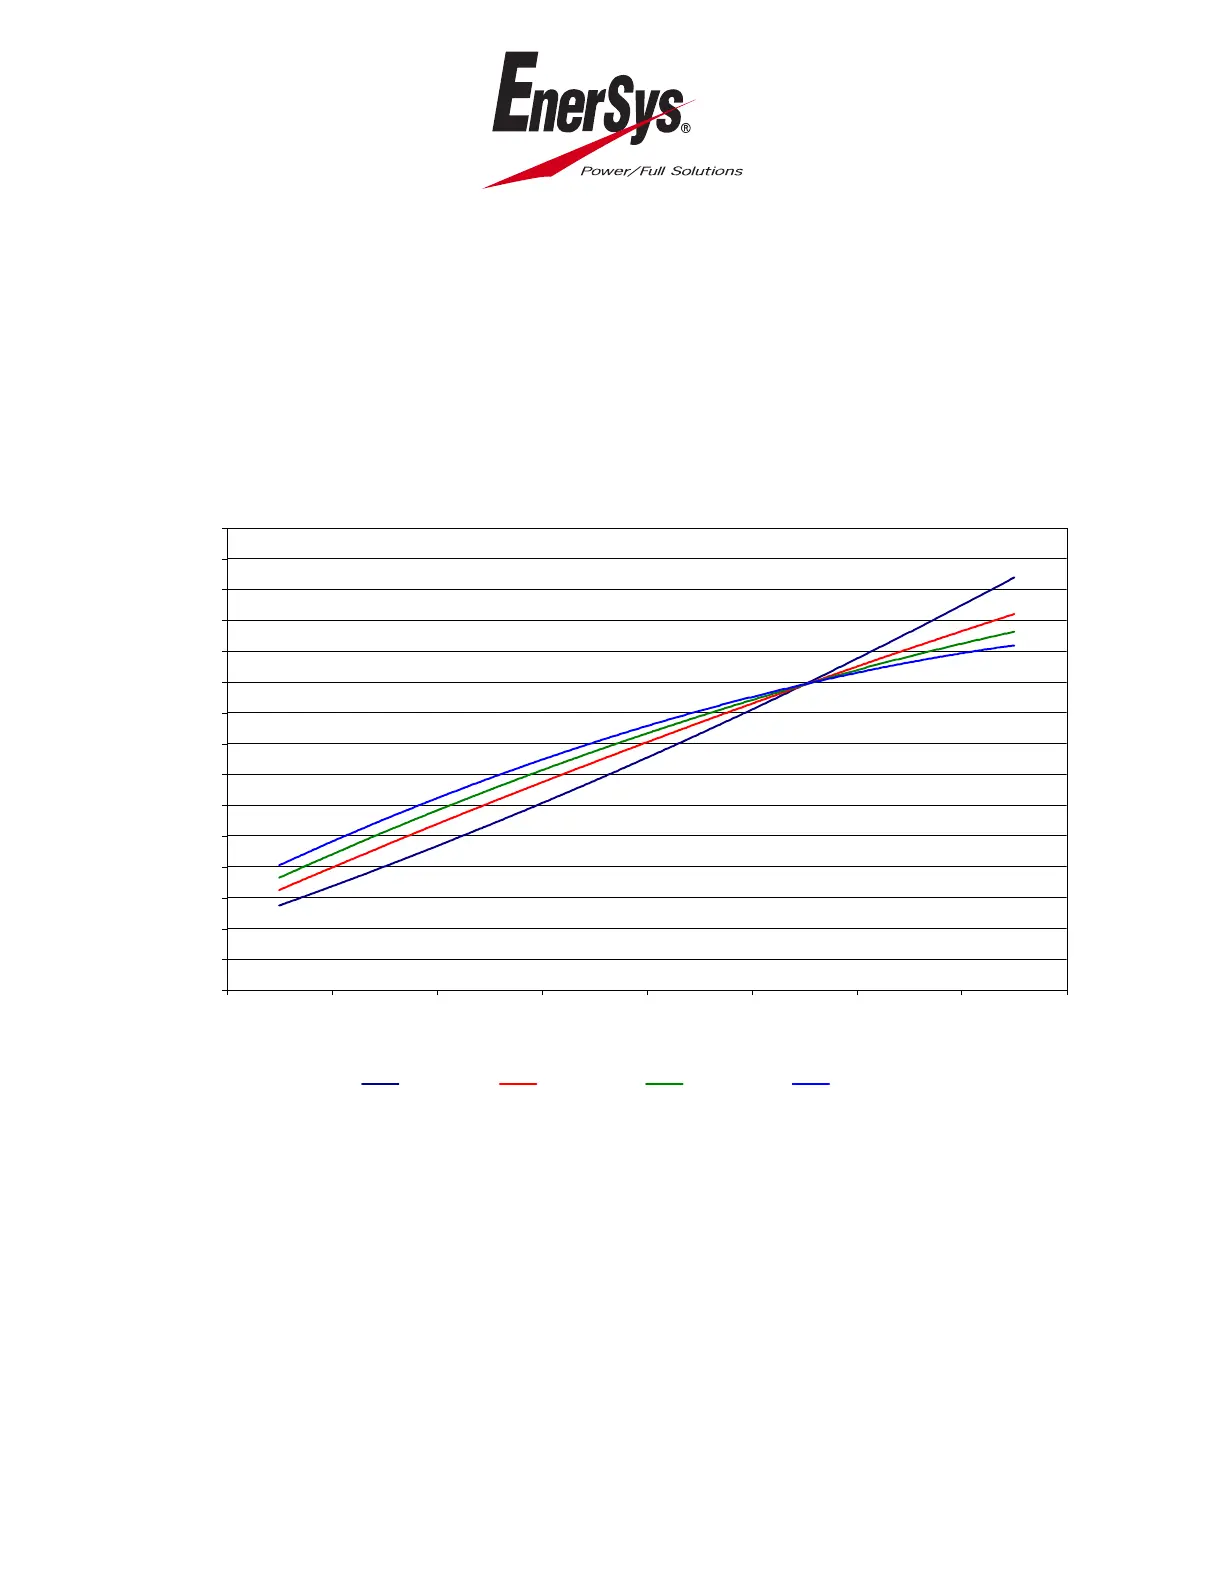
The graph in figure 2 demonstrates the effect of temperature on battery
capacity at various discharge rates.
Variation in Performance with Discharge Temperature
Figure 2
Page 5
June 09/06
DISCHARGE PERFORMANCE (SELECTED DISCHARGE RATINGS)
AS A FUNCTION OF TEMPERATURE
0
10
20
30
40
50
60
70
80
90
100
110
120
130
140
150
"-30 C "-20 C "-10 C 0 C 10 C 20 C 30 C 40 C
DEGREES CELSIUS
DISCHARGE PERFORMANCE AS % OF
PERFORMANCE @ 20oC
5 MIN RATE 15 MIN RATE 30 MIN RATE 60 MIN RATE
 Loading...