Copyright
©
2021 SolarV GmbH All rights reserved
Input power (P
PV
)= Output power (P
Bat
)
Input voltage (V
Mpp
) *input current (I
PV
) =Battery voltage (V
Bat
) *battery current (I
Bat
)
1.4
Maximum Power Point Tracking Technology
Due to the nonlinear characteristics of solar array, there is a maximum energy output point (Max Power
Point) on its curve. Traditional controllers, with switch charging technology and PWM charging
technology, can’t charge the battery at the maximum power point, so can’t harvest the maximum energy
available from PV array, but the solar charge controller with Maximum Power Point Tracking (MPPT)
Technology can lock on the point to harvest the maximum energy and deliver it to the battery.
The MPPT algorithm of our company continuously compares and adjusts the operating points to attempt
to locate the maximum power point of the array. The tracking process is fully automatic and does not
need user adjustment.
As the Figure 1-2, the curve is also the characteristic curve of the array, the MPPT technology will ‘boost’ the
battery charge current through tracking the MPP. Assuming 100% conversion efficiency of the solar system, in
that way, the following formula is established:
Normally, the V
Mpp
is always higher than V
Bat
, Due to the principle of conservation of energy, the I
Bat
is
always higher than I
PV
. The greater the discrepancy between V
Mpp
&V
Bat,
the greater the discrepancy
between I
PV
& I
Bat
. The greater the discrepancy between array and battery, the bigger reduction of the
conversion efficiency of the system, thus the controller’s conversion efficiency is particularly important in
the PV system.
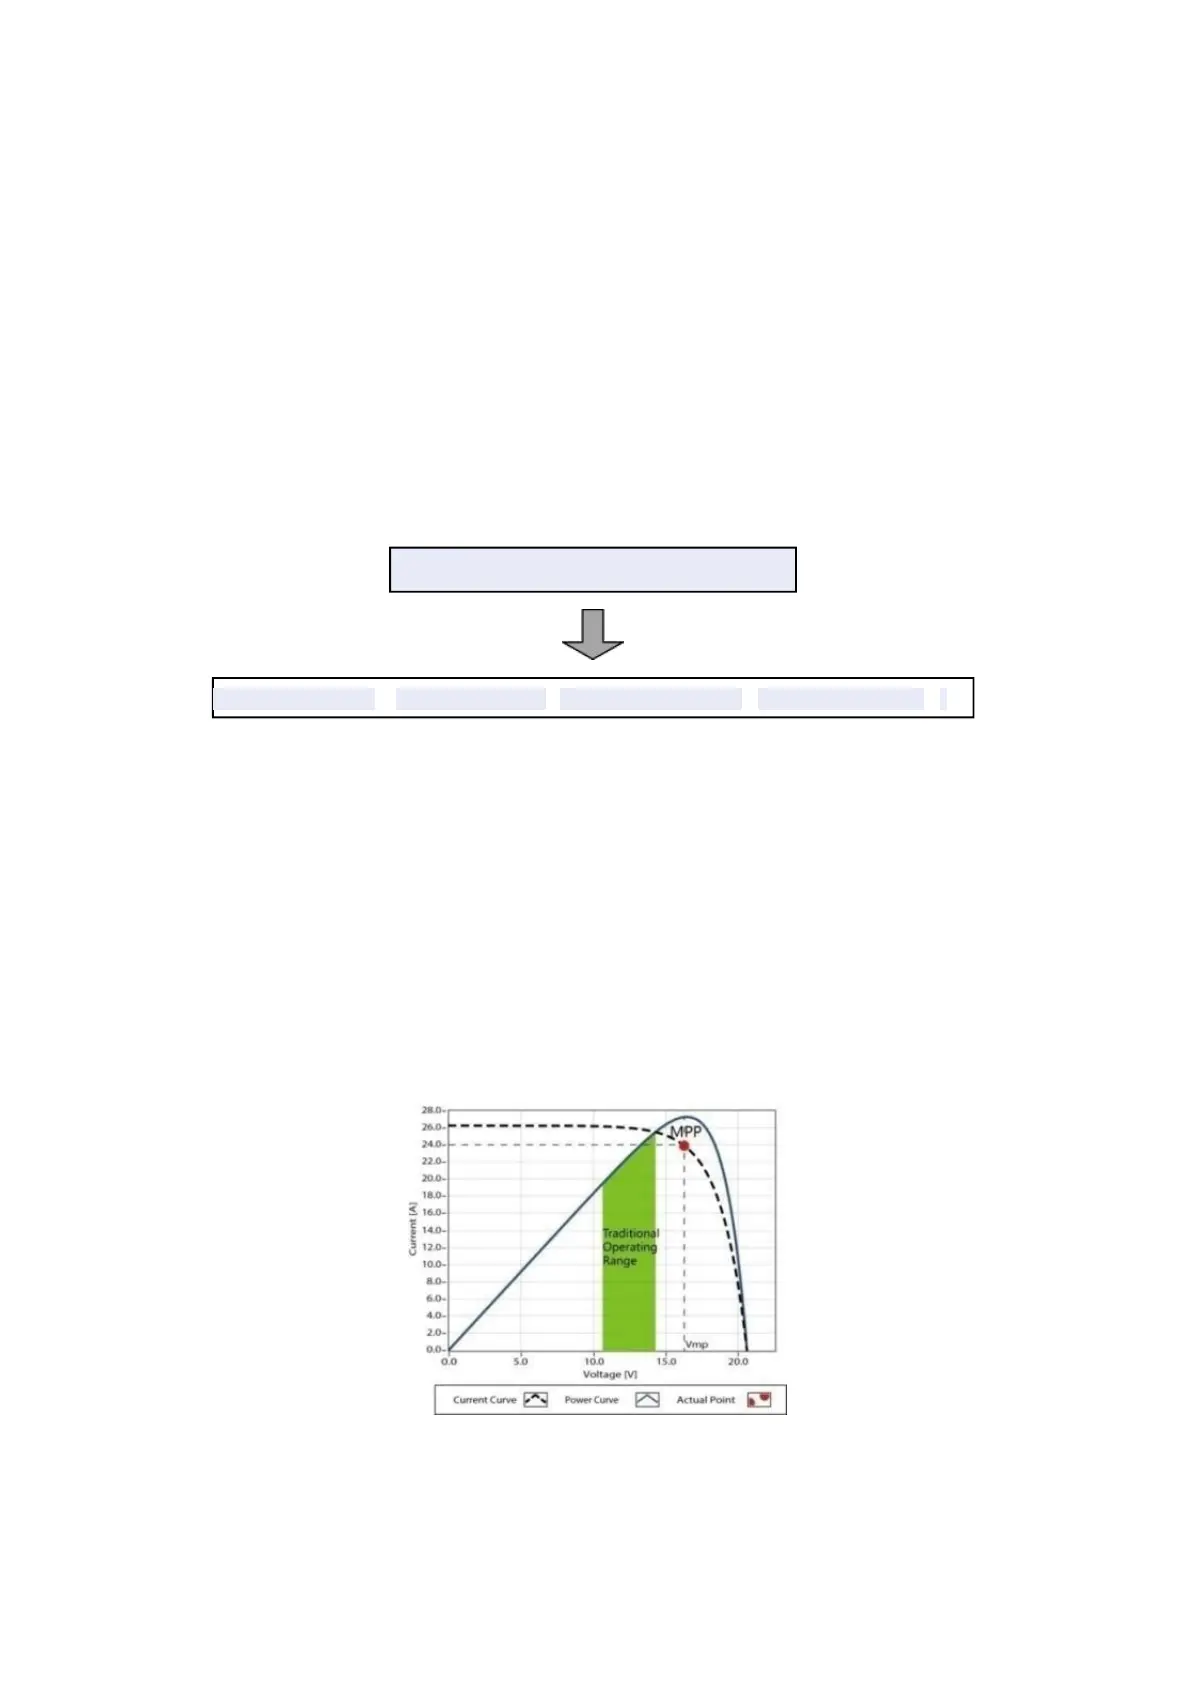
Figure 1-2 is the maximum power point curve, the shaded area is charging range of traditional solar
charge controller (PWM Charging Mode), it can obviously diagnose that the MPPT mode can improve the
usage of the solar energy resource. According to our test, the MPPT controller can raise 20%-30%
efficiency compared to the PWM controller. (Value may be fluctuant due to the influence of the ambient
circumstance and energy loss.)
Figure 1-2 Maximum Power Point Curve
 Loading...