117
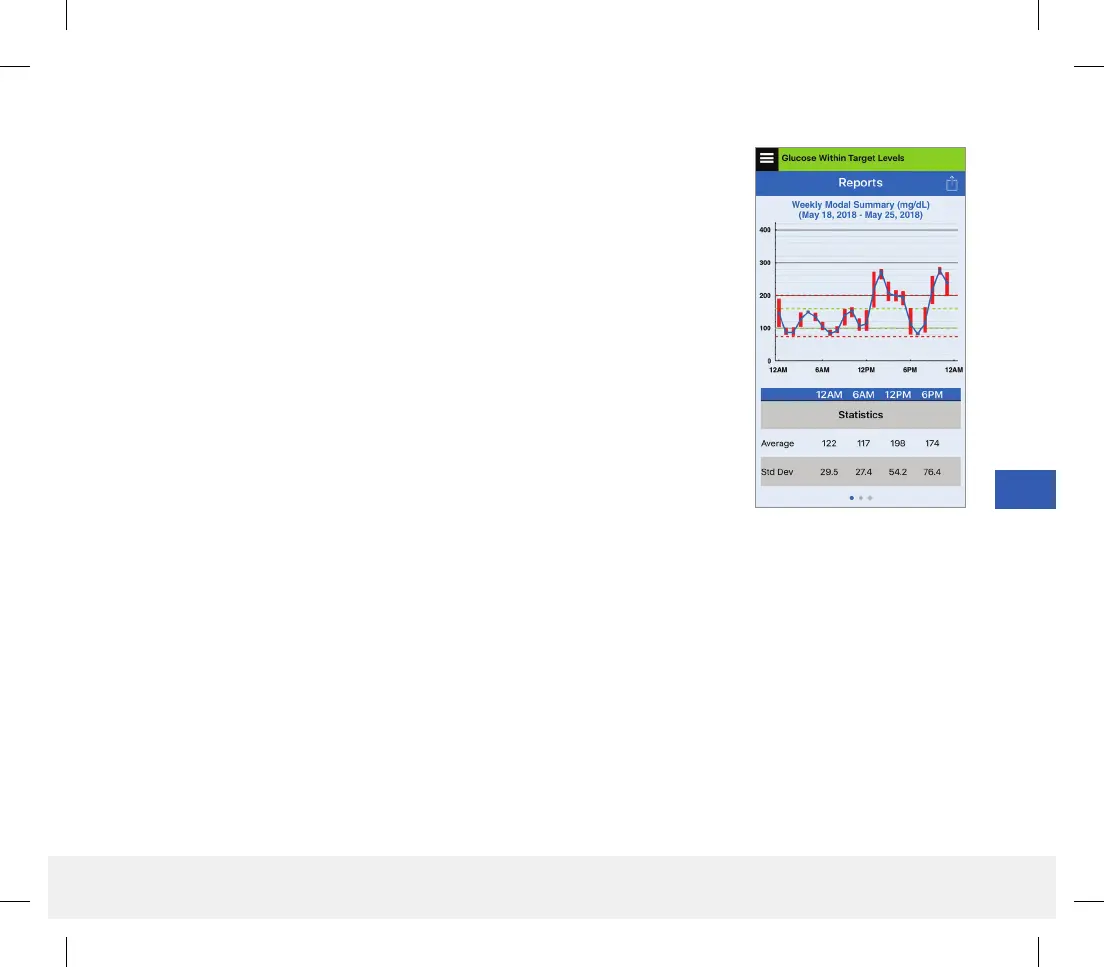
Weekly Modal Summary
This report shows your last seven days of glucose readings summarized in a
24-hour line graph format to help find patterns during the day.
• The blue line is the average of the last seven days of your readings in an
hour time block.
• The red bars show the highest and lowest actual readings in the same
hour time block.
• The red horizontal dotted lines are your pre-set High and Low Glucose
Alert levels.
• The green horizontal dotted lines are your pre-set High and Low Glucose
Target levels.
This report also provides summary statistics (average readings, standard
deviation of readings), glucose target performance (percent within, above
and below glucose target levels), and glucose reading highs and lows
(percent of readings that fall within the low and high glucose target levels).
The information is shown based on 6 hour time slots.
LBL-1602-01-001 Rev N_Eversense User Guide_mgdL_R1.indd 117LBL-1602-01-001 Rev N_Eversense User Guide_mgdL_R1.indd 117 2/26/20 12:59 PM2/26/20 12:59 PM