53
Get To Know the “My Glucose” Screen
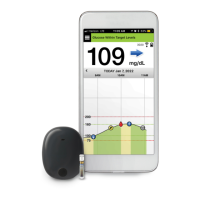
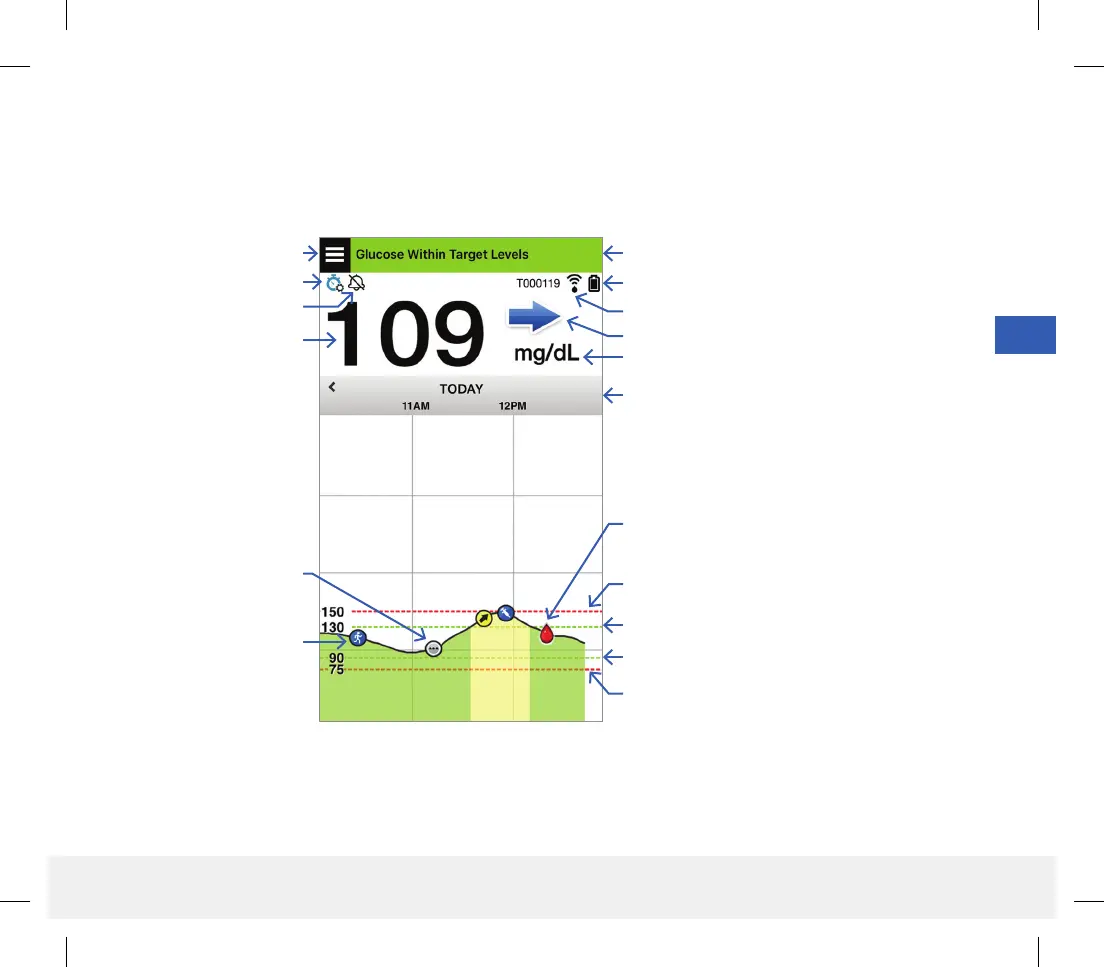
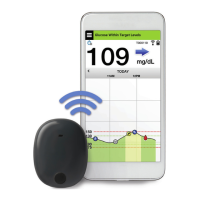
The MY GLUCOSE screen is the main display screen for the app. It displays a variety of data, including sensor
glucose readings, direction and rate of change arrow, trend graph, events, calibrations, alerts and notifications.
Before making a treatment decision, you should take into account the sensor glucose value, the trend graph, the
trend arrow and any alerts from the Eversense CGM System. If no trend arrow is displayed, the system does not have
enough data to display direction and rate of change. You should not make a treatment decision based solely on the
sensor glucose value.
Menu icon
Temp Profile icon
Date and time
Smart Transmitter battery power
Current glucose reading
Status bar
Multiple events mark
Trend arrow
Smart Transmitter connection to sensor
Unit of measurement
Low Glucose Alert level (Bottom red dashed line)
High Glucose Target level (Top green dashed line)
High Glucose Alert level (Top red dashed line)
Low Glucose Target level (Bottom green dashed line)
Calibration mark
Event mark
Do Not Disturb icon
LBL-1602-01-001 Rev N_Eversense User Guide_mgdL_R1.indd 53LBL-1602-01-001 Rev N_Eversense User Guide_mgdL_R1.indd 53 2/26/20 12:58 PM2/26/20 12:58 PM