118
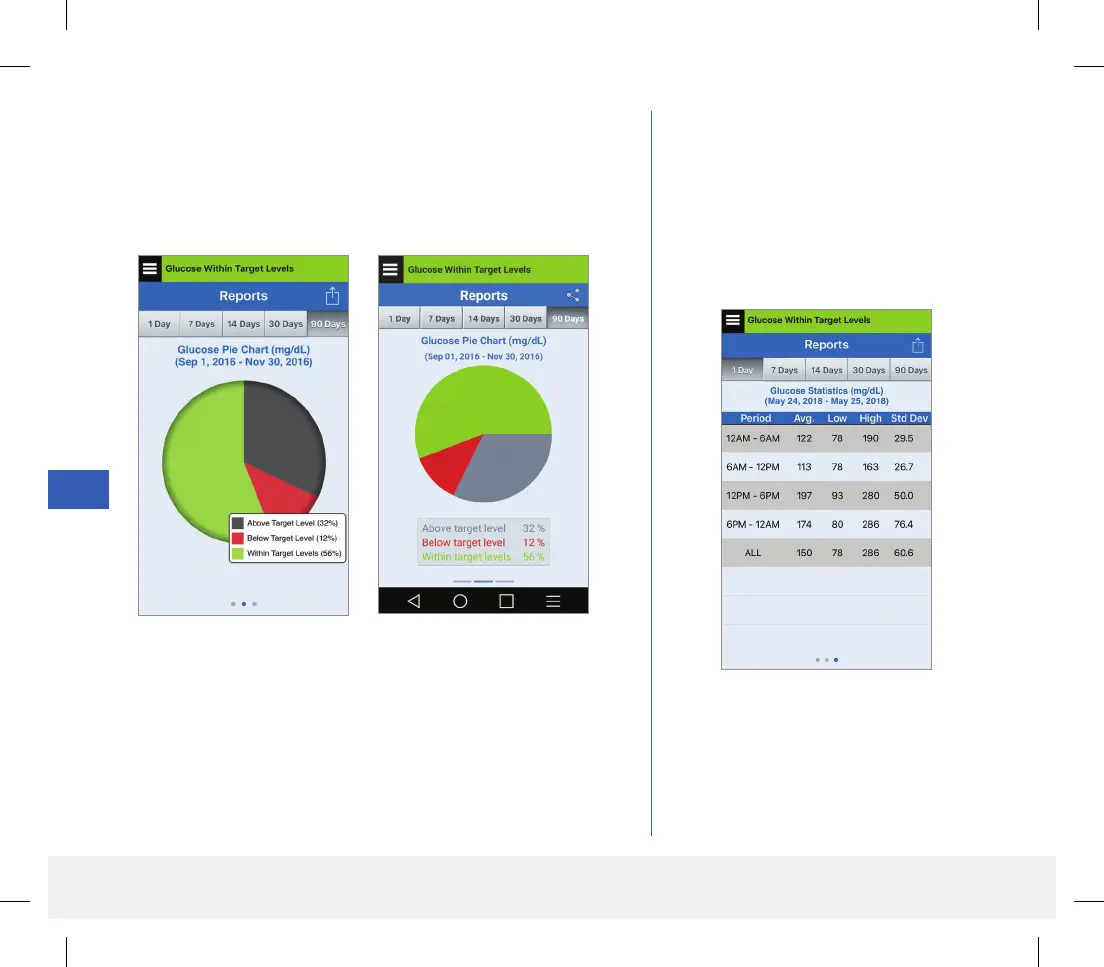
Glucose Pie Chart
This report shows in graphical format what percent of your readings
within a given time period are within, below or above your Glucose
Target levels. You can choose the last 1, 7, 14, 30 or 90 days.
Glucose Statistics
This report shows your average,
low and high glucose readings, along
with standard deviation within
6 hour time periods. You can choose
the last 1, 7, 14, 30 or 90 days.
iOS Android
11
LBL-1602-01-001 Rev N_Eversense User Guide_mgdL_R1.indd 118LBL-1602-01-001 Rev N_Eversense User Guide_mgdL_R1.indd 118 2/26/20 12:59 PM2/26/20 12:59 PM